pypepa is a PEPA library and a toolset for Performance Evaluation Process Algebra (PEPA) by Jane
Hillston. pyPEPA is not a fully PEPA compatible tool, it supports a limited (for now) PEPA syntax (we only allow <> operator in system equation), i.e. it does not suport hiding operator (e.g. P\{a,b,}), does not calculate passage time. pyPEPA also does not use Kronecker state space representation and Hillston's aggregation algorithms, so it can have worse performance than the PEPA Eclipse Plugin.
All these features, plus more, are planned to be added in next versions. If you are willing to help, just email me or put a pull request.
Warning: pyPEPA is under development, this is a beta software
pyPEPA consist of three parts:
- libpepa - a library written in Python,
- pyPEPA - a command line tool for solving and graphing,
- distr/ - map reduce tools for solving large PEPA experiments.
More docs can be found on readthedocs.
(19.05.2014) Switched completely to python > 3.3
(22.07.2013) Docs added, pypepa has now docs on rtd.org
(18.07.2013) pypepa can now calculate utilisations of components' states, output argument works again
(07.06.2013) Added support for defining rates as mathematical expressions, e.g. r=2*3+7*n;
Using pip:
$ pip install pypepaManually:
- Clone the project
$ git clone git@github.com:tdi/pyPEPA.git pypepa
$ cd pypepa- Run install
$ python setup.py installFor the current version I recommend installing in a virtualenv.
- Clone the project
$ git clone git@github.com:tdi/pyPEPA.git pypepa
$ cd pypepa- Make a virtualenv
$ mkvirtualenv -p /usr/bin/python3 pypepa
$ workon pypepa- Install all requirements
$ pip install pyparsing numpy scipy matplotlibShow help command:
$ pypepa -hSet logging level (the default is NONE):
$ pypepa --log {DEBUG, INFO, ERROR, NONE}Calculate steady state for bank scenario. The putput is by default directed to your terminal.
$ pypepa -st models/bankscenario.pepa

Statespace of models/bankscenario.pepa.1 has 7 states

Steady state vector
Using ; delimiter
1;Idle,WaitingForCustomer,WaitingForEmployee;0.08333333333333337
2;Informed,WaitingForCustomer,WaitingForEmployee;0.25
3;WaitingBankResponse,RequestReceived,WaitingForEmployee;0.16666666666666666
4;WaitingBankResponse,CustomerNotReliable,WaitingForEmployee;0.16666666666666666
5;WaitingBankResponse,CustomerReliable,WaitingForEmployee;0.16666666666666666
6;WaitingBankResponse,WaitingManagerResponse,EvaluatingOffer;0.08333333333333333
7;OfferReceived,WaitingForCustomer,WaitingForEmployee;0.08333333333333333
Calculate actions' throughput:
$ pypepa -th models/bankscenario.pepa

Statespace of models/bankscenario.pepa.1 has 7 states

Throuhput (successful action completion in one time unit)

readInformation                          0.08333333333333337
createLoanRequest                              0.25
getNotReliableMessage                    0.16666666666666666
badOffer                                 0.08333333333333333
askManager                               0.16666666666666666
reset                                    0.08333333333333333
goodOffer                                0.08333333333333333
checkReliability                         0.3333333333333333
You can calculate transient time proability for some number of time steps:
$ pypepa --transient 5 models/bankscenario.pepa

Transient analysis from time 0 to 10

Using ; delimiter
1;Idle,WaitingForCustomer,WaitingForEmployee;0.08351202761947342
2;Informed,WaitingForCustomer,WaitingForEmployee;0.2500169897974121
3;WaitingBankResponse,RequestReceived,WaitingForEmployee;0.16662129023697114
4;WaitingBankResponse,CustomerNotReliable,WaitingForEmployee;0.16657721277634494
5;WaitingBankResponse,CustomerReliable,WaitingForEmployee;0.16657721277634485
6;WaitingBankResponse,WaitingManagerResponse,EvaluatingOffer;0.08328947039778702
7;OfferReceived,WaitingForCustomer,WaitingForEmployee;0.08340579639566591
You can choose a solver by specifying --solver|-s {direct, sparse}.
By defalt we use sparse solver with LIL matrix becuase it is faster and in overall matrices generated from PEPA models are sparse. There is also an insignificant difference in results.
pypepa allows you to visualise all PEPA components and the whole state space of a model by specifying -gd switch. The generated graphiz dot files are by deault saved in dots folder in the current directory. You can browse dot files with xdot, which you need to install first.
$ pypepa -gd bankdots models/bankscenario.pepaFinally pypepa can provide us with a tool for experimentation with rates and actions.
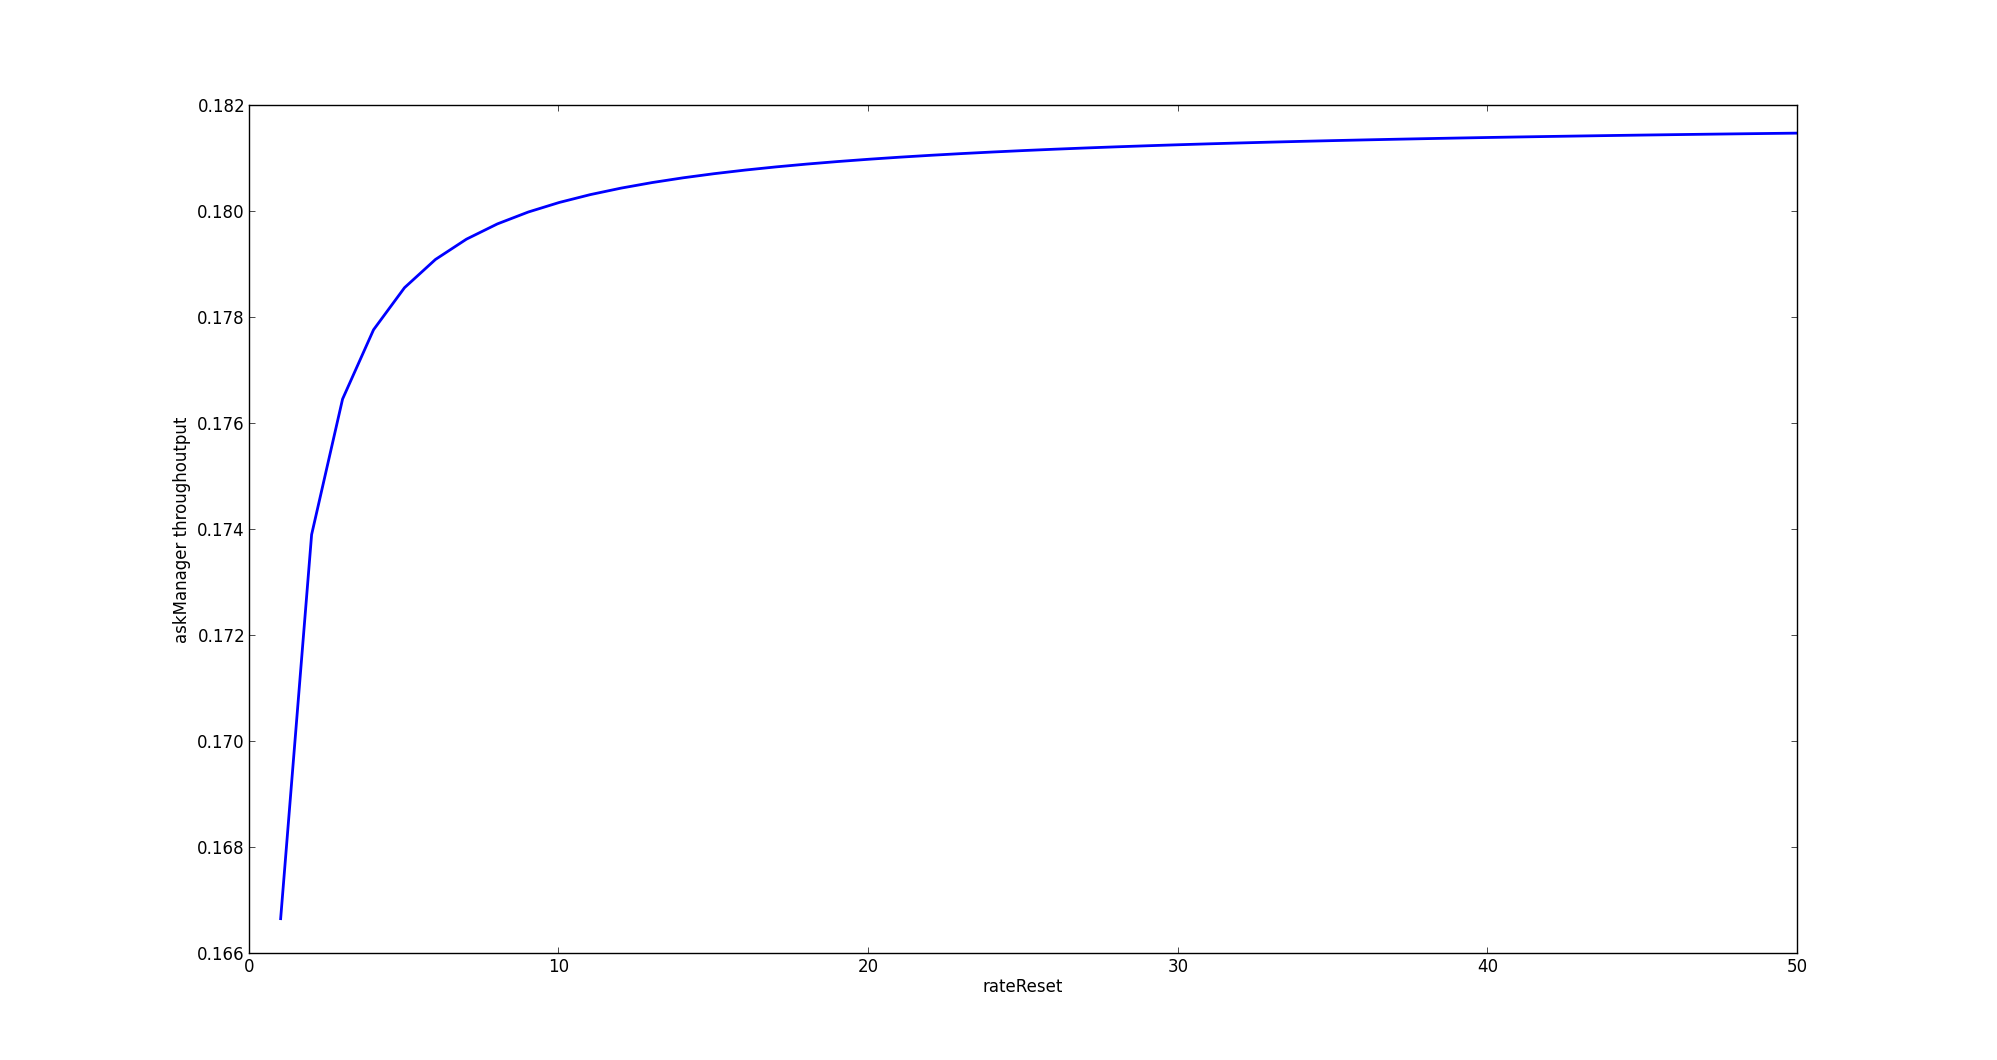
Let's check how throughtput of askManager action changes when rateReset changes from 1 to 50 with step 1. The default result of this command will be a matplotlib graph.
The format of -var is "vartype:varname:value range specifier:value range value". The one valid
vartype for now is rate, for value range specifiers you can choose: range or list. For range
you need to provide START, STOP, STEP, whereas for list a comma separated list of values.
You can specify other output options with -f argument: graph, console, csv.
$ pypepa -var "rate:rateReset:range:1,50,1" -val askManager models/bankscenario.pepaYou can specify formats of -st, -th and --varrate with a --format option.
Currently we support CSV (although ; not comma delimited), console (the default) and graph (only
for varrate experiments). Additionally you can specify -o|--output option with a file argument to specify where to save the CSV.
$ pypepa -st models/bankscenario.pepa -f csv -o bank_steady.csv- Implement rate mathematical expressions with functional rates (DONE)
- Implement passage time analysis
- Implement hiding operator
- Implement 3d graphs and experiments (DONE)
- Implement Kronecker state space and aggregation
- Implement generalised communication PEPA genPEPA by Mirco Tribastone
- Add model manipulation language for reducers
- Add stochastic probes
- Add distributed version of BU algorithm
- Add importing of models and components from external files (and namespaces)
- Optimise optimise optimise
Copyright (c) Dariusz Dwornikowski and Poznan University of Technology. Distributed under the Apache Commons 2.0.


