Mollweide projection ignores axis breaks in geom_sf() #3944
Description
When using a Mollweide projection (crs = 54009), ggplot2 ignores the axis breaks given by scale_x|y_continuous(). See reprex and output.
library(sf)
#> Linking to GEOS 3.7.2, GDAL 2.4.2, PROJ 5.2.0
library(ggplot2)
library(dplyr)
#>
#> Attaching package: 'dplyr'
#> The following objects are masked from 'package:stats':
#>
#> filter, lag
#> The following objects are masked from 'package:base':
#>
#> intersect, setdiff, setequal, union
grid <- st_sf(st_make_grid(what = 'polygons'))
ggplot(grid) +
geom_sf() +
scale_y_continuous(breaks = c(-60, -30, 0, 30, 60)) +
coord_sf(crs = st_crs(54009)) + # Mollweide
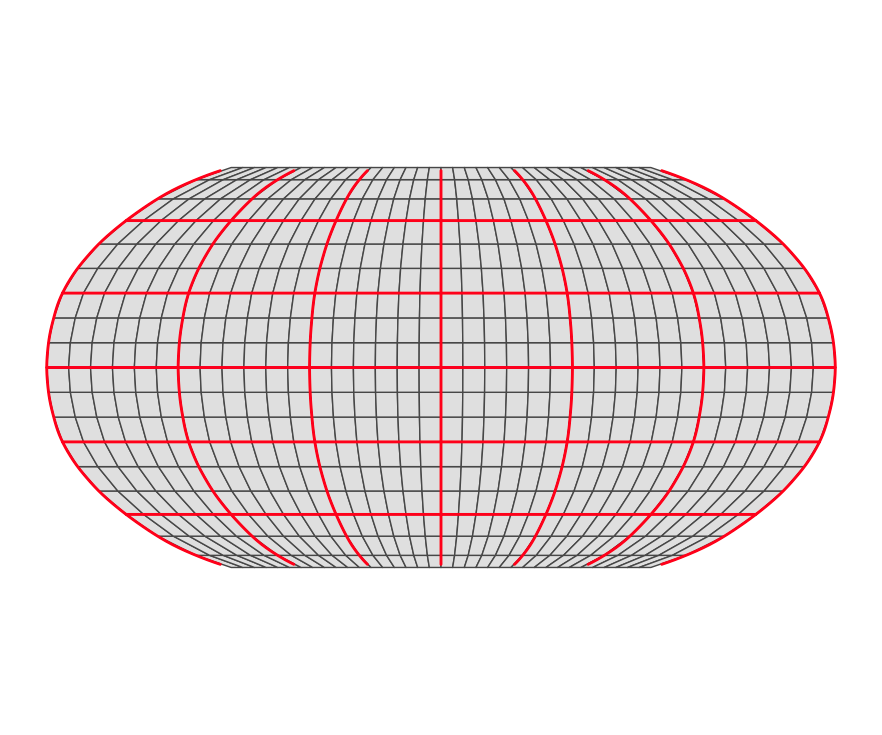
#coord_sf(crs = st_crs(54030)) + # Robinson
theme(
panel.background = element_blank(),
panel.ontop = TRUE,
panel.grid.major = element_line(color = 'red',
size = 1))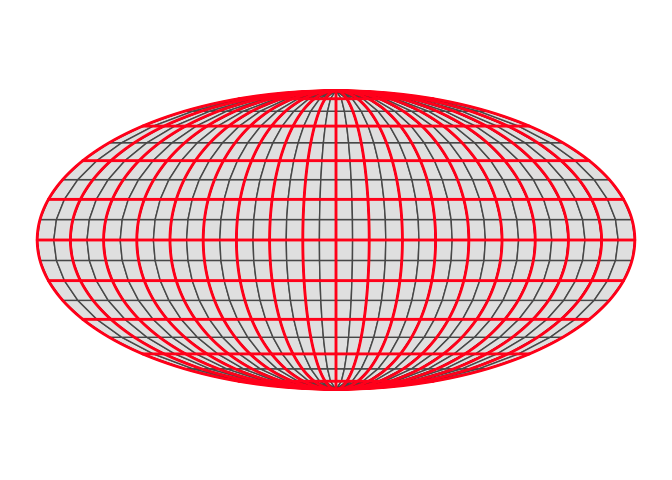
Created on 2020-04-11 by the reprex package (v0.3.0)
Comparison with a Robinson projection.