Map cut on the “eges” of x-axis using Aitoff projection #4178
Description
I am trying to plot with ggplot2 (v3.3.2) data points on a map using a specific projection (called aitoff), which is useful especially for sky plots.
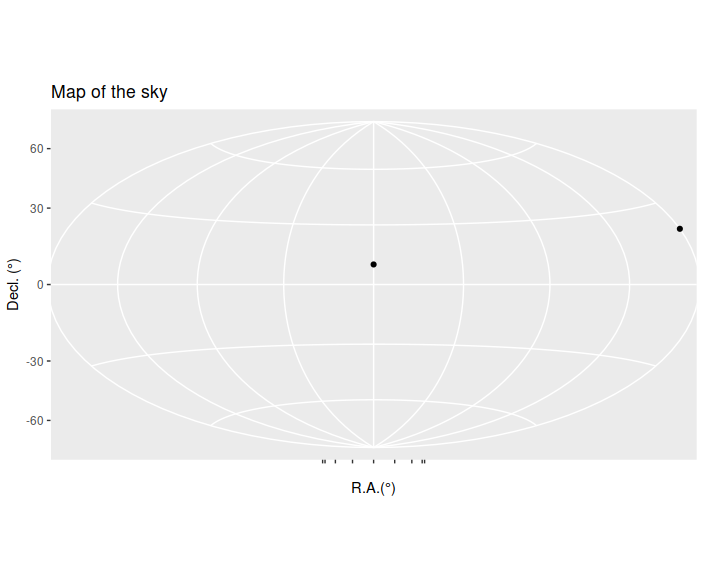
When doing so, the plot is "cropped" on the x-axis, i.e. the edges of this axis are located just outside the plot. For example, the point located at (0,0) is not visible, as shown in the figure below.
Here is the code to reproduce the issue:
skydata <- data.frame(RA=c(0,180,360), Dec=c(0,10,20))
ggplot(skydata) +
    geom_point(aes(RA,Dec)) +
    coord_map(projection="aitoff",orientation=c(90,180,0)) +
    scale_y_continuous(breaks=(-2:2)*30,limits=c(-90,90)) +
    scale_x_continuous(breaks=(0:8)*45,limits=c(0,360), labels=c("","","","","","","","","")) +
    labs(x="R.A.(°)", y="Decl. (°)",title="Map of the sky")
I tried a few things (adjust the margin for example), but without success. Could you help me please?
Thanks!
Note: also posted to Stack Overflow...