Add the possibility to have guides lines when using coord_polar() #4758
Description
Request
So here is my feature request: Add a way to draw simple lines when using coord_polar() so that one can a) add them as guides to make the plot more readable and b) draw them behind other geoms so they are not obstructing the view.
Longer version
Dear ggplot2 maintainers,
I want to create polar histograms with ggpot2 and off the bat I think they look great in ggplot. However there is one issue with the type of plot I created below (code if necessary can be found at the end)

and that is that this type of plot is that it is very difficult to read. More specifically it is difficult to map the count (or more generally speaking the y-axis) ticks and tick labels to the distance from the circles. That's why I would love to add guides lines from the ticks to the vertical axs of the circle. I have added an example for reference that I have done following a suggestion from https://stackoverflow.com/questions/71476327/add-guide-lines-for-y-axis-when-using-coord-polar-for-polar-histogram
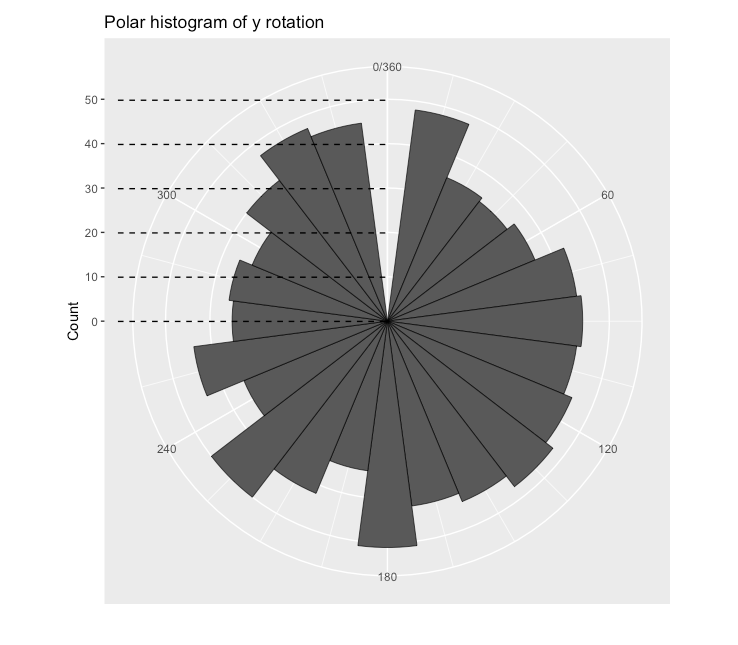
So far, I have only been suggested a very hacky way of adding these lines and preferably it would be good to have the lines behind the geoms (e.g. the histogram in my case), which doesn't seem to work. I am also aware of another hack to draw straight lines when using coord_polar() (https://stackoverflow.com/questions/66196451/draw-straight-line-between-any-two-point-when-using-coord-polar-in-ggplot2-r) but the issue with that solution is that you cannot seem to draw from the tick because if the lines is too long it just disappears.
Code to reproduce
library(ggplot2)
# Seed
set.seed(20220315)

# Create random data from 0 to 360
example_dat <- data.frame(rot_y = runif(1000, min = 0, max = 360))

# Create polar plot
ggplot(example_dat, aes(x = rot_y )) +
  geom_histogram(binwidth = 15, boundary = -7.5, colour = "black", size = .25) +
  scale_x_continuous(limits = c(0,360),
                     breaks = seq(0, 360, by = 60),
                     minor_breaks = seq(0, 360, by = 15))  +
  coord_polar() +
  labs(title = 'Polar histogram of y rotation',
       y = 'Count',
       x = '')