Skip to content

own geom function draw violin connected with lines #4932

@junjunlab

Description

@junjunlab

Hello, I am buiding a stat and geom function to draw violin plot, but I find the multiple polygens are conected with lines, I do not know the reason, here are my code:

# ==============================================================================
# stat
StatJjviolin <- ggproto("StatJjviolin", Stat,
                     # compute data
                     compute_group = function(data, scales) {
                       # calculate density
                       density_data <- density(data$y,
                                               # from = range(data$y)[1],
                                               # to = range(data$y)[2],
                                               bw = "nrd0", adjust = 1,
                                               kernel = "gaussian",
                                               n = 512)
                       
                       new_daframe <- data.frame(vio_y = density_data$x,
                                                 vio_x = density_data$y,
                                                 ymin = min(data$y),
                                                 ymax = max(data$y))
                       
                       # add x
                       new_daframe$x <- data$x[1]
                       
                       # print(new_daframe)
                       new_daframe
                       
                     },
                     required_aes = c("x", "y")
)

stat_jjviolin <- function(mapping = NULL, data = NULL, geom = "jjviolin",
                       position = "identity", show.legend = NA,
                       # outliers = TRUE, 
                       inherit.aes = TRUE, ...) {
  ggplot2::layer(
    stat = StatJjviolin,
    data = data,
    mapping = mapping,
    geom = geom,
    position = position,
    show.legend = show.legend,
    inherit.aes = inherit.aes,
    params = list(...)
  )
}

# ==============================================================================
# geom
GeomJjviolin <- ggproto("GeomJjviolin", Geom,
                     required_aes = c("x", "vio_x", "vio_y"),
                     default_aes = aes(lwd = 0.5,
                                       width = 0.9,
                                       colour = 'black',
                                       fill = 'grey80',
                                       linetype = 1),
                     
                     # plot legend
                     draw_key = function(data, params, size) {
                       if (is.null(data$size)) {
                         data$size <- 0.5
                       }
                       
                       lwd <- min(data$size, min(size) / 4)
                       
                       rectGrob(
                         width = unit(1, "npc") - unit(lwd, "mm"),
                         height = unit(1, "npc") - unit(lwd, "mm"),
                         gp = gpar(
                           col = data$colour %||% NA,
                           fill = data$fill %||% "grey20",
                           lty = data$linetype %||% 1,
                           lwd = lwd * .pt))
                     },
                     # transform data
                     draw_panel = function(data, panel_scales, coord) {
                       
                       data <- data %>%
                         mutate(vio_x = rescale(vio_x,
                                                # from = panel_scales$x.range,
                                                to = c(0,unique(data$width/2))))
                       
                       print(head(data,3))
                       # print(data)
                       # write.csv(data,'coords.csv',row.names = F)
                       
                       n <- nrow(data)
                       if (n == 1) return(zeroGrob())
                       
                       coords <- coord$transform(data, panel_scales) %>%
                         mutate(width = rescale(width, from = panel_scales$x.range),
                                vio_y = rescale(vio_y,from = panel_scales$y.range))
                       
                       print(head(coords,3))
                       # print(panel_scales$y.range)
                       # print(panel_scales$x.range)
                      
                       # write.csv(coords,'coords.csv',row.names = F)
                       
                       first_idx <- !duplicated(coords$group)
                       first_rows <- coords[first_idx, ]
                       
                       print(first_rows)
                       
                       # polygen
                       polygen <- polygonGrob(x = c(coords$x - coords$vio_x,
                                                    rev(coords$x + coords$vio_x)),
                                              y = c(coords$vio_y,
                                                    rev(coords$vio_y)),
                                              gp = gpar(fill = first_rows$fill,
                                                        col = first_rows$colour,
                                                        lwd = first_rows$size,
                                                        lty = first_rows$linetype))
                       
                       # combine
                       gTree(children = gList(polygen))
                       
                      }
         
)


geom_jjviolin <- function(mapping = NULL, data = NULL, stat = "jjviolin",
                       position = "identity", show.legend = NA,
                       na.rm = FALSE, 
                       inherit.aes = TRUE,
                       ...) {
  layer(
    data = data,
    mapping = mapping,
    stat = stat,
    geom = GeomJjviolin,
    position = position,
    show.legend = show.legend,
    inherit.aes = inherit.aes,
    params = list(na.rm = na.rm,...)
  )
}

# TEST
ggplot(mtcars,aes(x = factor(cyl),y = mpg)) +
  geom_jjviolin(width = 0.25)

image

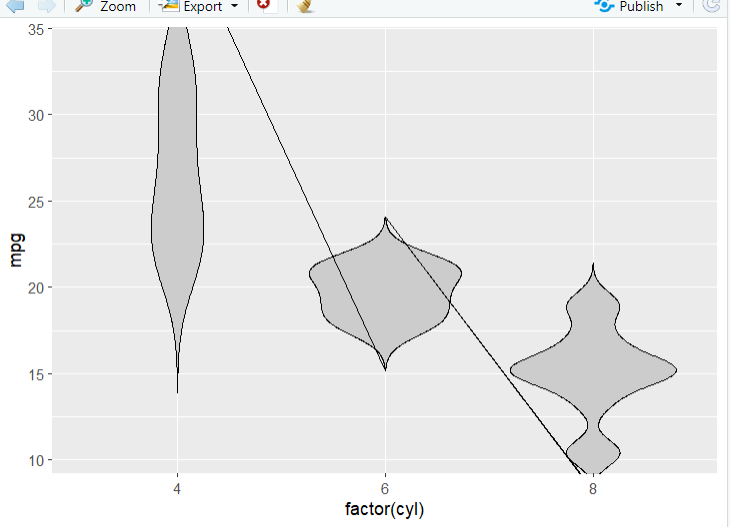
Thank you for your help!

Metadata

Metadata

Assignees

No one assigned

    Labels

    No labels
    No labels

    Type

    No type

    Projects

    No projects

    Milestone

    No milestone

    Relationships

    None yet

    Development

    No branches or pull requests

    Issue actions