geom_histogram and color="white" hide x-axis with themes using white background #4976
Description
I've been making some histograms and was puzzled by the appearance of the x-axis. I finally narrowed it down, and it's my combination of color="white" and theme_minimal(). I think the issue is more generalized:
- impacts themes using a white background
- I suspect it affects all bar geoms, not just histograms
- setting
color="white"must plot a zero height bar, which results in blanking out that section of the x-axis
This could be intended... but in my opinion it would be more expected if the grid line were drawn on top of/instead of the bottom white boundary around bars.
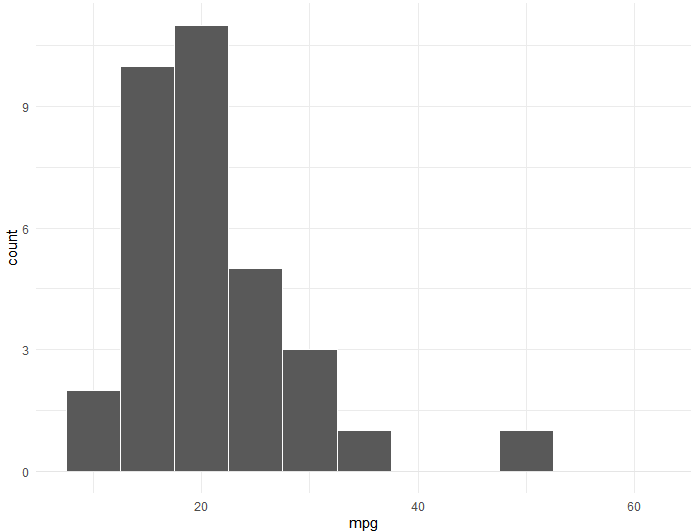
# load libraries, and add a high mpg row so we get some gaps between bars
library(dplyr)
library(ggplot2)

mtcars2 <- mtcars %>%
  add_row(mpg = 50)
With a default plot, the issue isn't noticeable as the border color and x-axis grid line are both white:
ggplot(mtcars2, aes(x = mpg)) +
  geom_histogram(binwidth = 5, color="white") +
  expand_limits(x = 60)
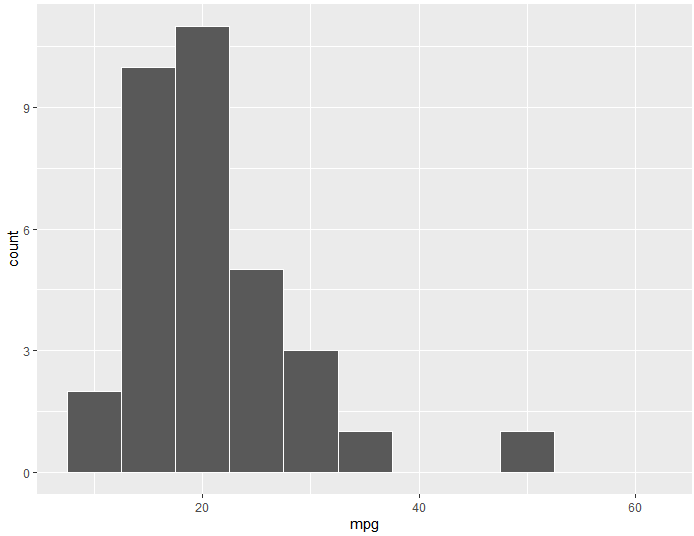
When applying theme_minimal() however, the now-black grid line is hidden by the bar outline:
ggplot(mtcars2, aes(x = mpg)) +
  geom_histogram(binwidth = 5, color="white") +
  expand_limits(x = 60) +
  theme_minimal()

Again, maybe this is expected/known/user-beware... but I still wanted to raise as it surprised me and I don't think it looks good.
I probably could chase this down in the code, but with a few guesses, I found that adding a grey90 colored geom_hline() works:
ggplot(mtcars2, aes(x = mpg)) +
  geom_histogram(binwidth = 5, color="white") +
  expand_limits(x = 60) +
  geom_hline(yintercept=0, color="grey90") +
  theme_minimal()