Repository navigation
Releases
tradoor 0.9.0

A strategy tester on every chart, run in your browser, a public room to talk in, and a lighter start.
Try it: https://tradoorterminal.com
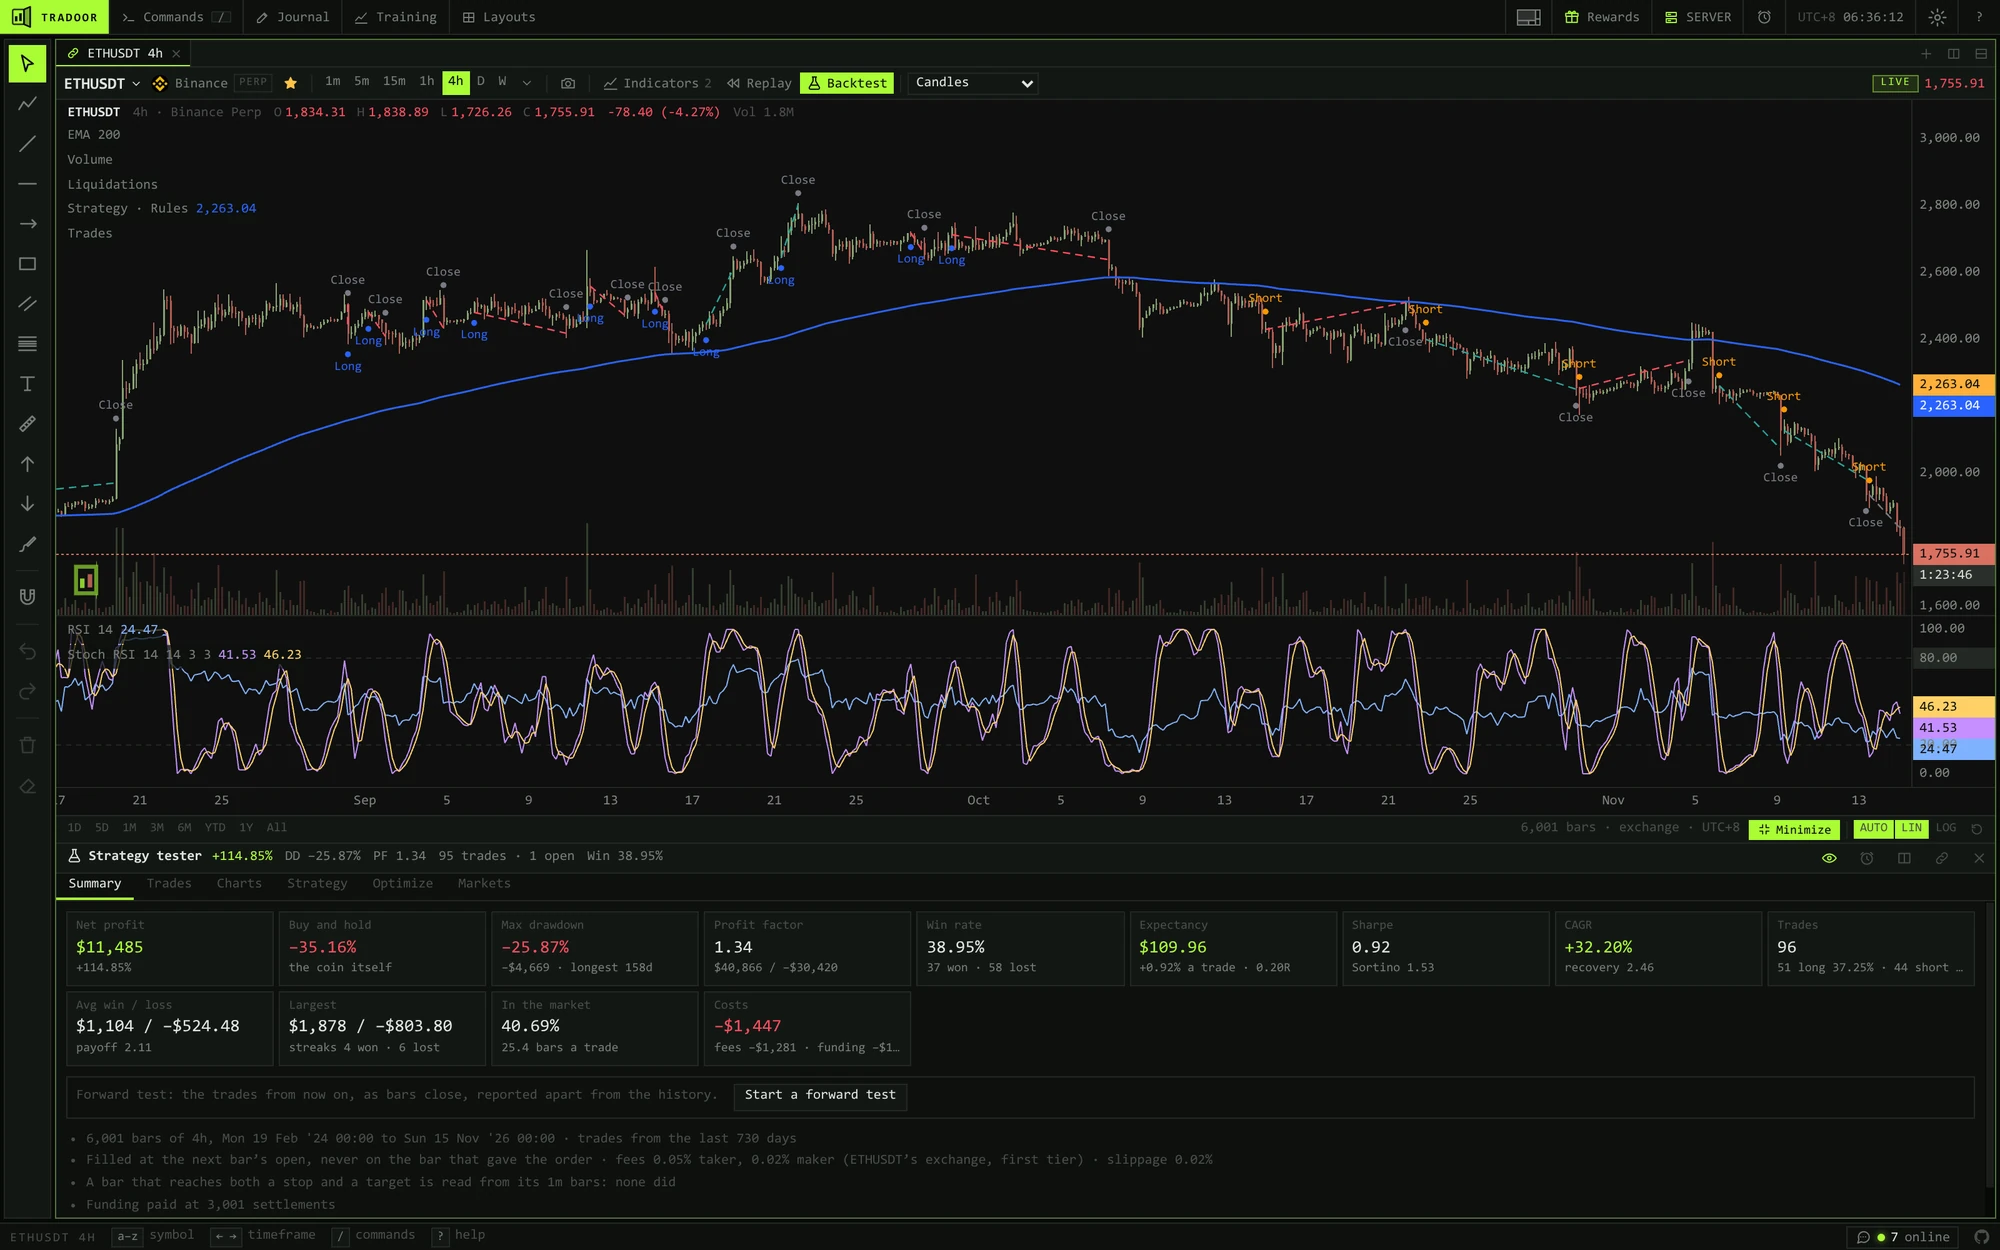
Strategy tester
- On any chart: Backtest, on the chart's toolbar, tests a strategy on that market and timeframe. It runs in your own browser, in a worker of its own, so a test of years of bars asks the server for nothing more.
- Start from a template: Follow the trend, Buy the dip, Breakout, Bollinger bounce and MACD with the trend fill in the rules, ready to change. Choose whether it buys, sells short or trades both ways.
- Rules from lists, read back as sentences: pick a price, an average, RSI, MACD, Bollinger, ATR, a breakout or volume, then crosses above, is below and so on. Each side's rules are written out under them, such as "Buys when MACD 12 26 9 crosses above MACD signal 12 26 9, and Close is above EMA 200."
- Close and guard the trade: a stop loss in percent or ATR, a take profit as a multiple of the stop or in percent, a trailing stop, or a limit on the bars held.
- Money: a share of the account, a fixed amount or a fixed risk on each trade, and leverage, with a warning where it would be liquidated.
- Tested over: what the chart holds, three months to five years, a market's whole history, or from a date, up to 100,000 bars. Bitstamp's BTC from 2011 on a daily chart is one test.
- Or write it: Write code takes a Frost Script strategy, from an example or pasted from an AI chat. My scripts runs one of your saved scripts, or a public strategy from the Community.
- Beside the chart or under it: a button in the tester's header moves it, so the chart and the settings sit side by side. On a phone it stays under the chart.
How it fills
- As a live trade would: an order given at a bar's close fills at the next bar's open, and a gap fills at the open. A limit order waits one bar.
- Each exchange's costs: its first-tier taker and maker fees, slippage on market and stop fills, and funding from the exchange's own history on Binance, Bybit, OKX, Bitget and Hyperliquid perpetuals. Funding and liquidation were checked by hand against Binance's figures, and match.
- A bar that hits the stop and the target: the tester reads that bar's 1m bars to see which came first. Where it cannot, it takes the stop and says how many bars were decided that way.
The report
- Summary: net profit against buying and holding the coin, drawdown, profit factor, win rate, expectancy, Sharpe and Sortino, CAGR, costs, and notes on what was tested and how. It says when a trade is still open, or when a side never entered.
- Trades: every trade, with how far it went against you and for you, drawn on the chart and saved as CSV.
- Charts: the equity against holding the coin, drawdowns, returns by month, how the results spread, and a Monte Carlo of the trades.
- Optimize: tries the settings on a grid and keeps part of the bars back, so the best one is checked on bars it never saw.
- Markets: the same strategy on other markets at once.
- Forward test and notices: count the trades from now on apart from the history, and get a notice whenever a bar closes with an order, while tradoor is open.
- Share it: a link carries the strategy and its settings, for anyone to test in their own browser.
Frost Script
- Strategies:
long,short,exit,stopandtargetgive orders, andinlong,inshort,entrypriceandbarsheldsay where the trade stands. Orders can be given insideif. - Mending an AI's conversion: a script pasted with its line breaks lost, as some chats copy it, gets them back. Pine Script left in a conversion, such as
ta.,:=,input.int,strategy.entryorcolor.new, is written as Frost Script, and the editor says what it could not carry over. - Words as values:
above,below,left,right, sizes fromtinytohuge, and the others work as values, as an AI often writes them.
tradoor messenger
- One public room: the speech bubble by the GitHub mark, at the bottom right, opens it, with how many are online. Anyone can write, no account needed.
- Kept clean: links in any spelling, wallet addresses and keys, and scam bait are refused, and readers can report a message. A
$BTCtag shows the price.
Faster start
- Less to load: the footprint recorder and order flow load only when a chart needs them, which took the JavaScript loaded at start from 76.1 to 66.0 kB.
Community
- The Community tab, while empty, links to the showcase, where every public script is drawn live.
Self-hosting
- Two migrations (V41 and V42, the messenger) run by themselves when the server starts.
- Moderating the messenger: with
TRADOOR_ADMIN_KEYset,/online.htmltakes messages down, mutes a sender, and can hold the room to accounts only. - The relay now passes the funding-history requests of Binance, Bybit, OKX and Bitget, for a backtest when a browser cannot reach them itself.
Full changes: v0.8.3...v0.9.0
tradoor 0.8.3
tradoor has a home of its own on GitHub, a new demo, and a README for Frost Script.
Try it: https://tradoorterminal.com
tradoor moved to github.com/tradoor-terminal
- The new address: the code now lives at https://github.com/tradoor-terminal/tradoor. Stars, forks, issues, Discussions and releases came along.
- Old links keep working: github.com/rsalianto/tradoor, and
git cloneorgit pushto it, are sent on to the new address. To point an existing clone at it:git remote set-url origin https://github.com/tradoor-terminal/tradoor.git - The app's GitHub button opens the new address.
A new demo
- Smooth, scene by scene: pan and zoom, a footprint up close in delta and bid × ask, TPO profiles by day, a Frost Script swing map, six charts at once, the DOM and tape, and the Community showcase.
- A footprint you can read: filmed close, every cell's figure, the per-bar table and the volume profile are legible, even at the README's size.
Frost Script
- A README of its own: crates/frost-script says what the language does, how a script is kept safe, with its limits, and how the crate is built and tested.
Self-hosting
- The image's new name: CI now pushes
ghcr.io/tradoor-terminal/tradoor. A server deployed by CI moves to it by itself. Images from before 0.8.3 stay atghcr.io/rsalianto/tradoor, for a rollback to them.
Full changes: v0.8.2...v0.8.3
tradoor 0.8.2
RSI and Stoch RSI in one pane or two, a legend for every pane, a tidier legend on phones, and tradoor's own indicators on the Community showcase.
Try it: https://tradoorterminal.com
Panes
- RSI and Stoch RSI, together or apart: they share a pane as before. Point at the pane and its buttons show at its top right: ↓ gives Stoch RSI a pane of its own, and ↑ in that pane puts it back. The chart remembers which you chose.
- Remove a pane in one click: the trash at a pane's top right takes away every indicator in it.
- A legend for every pane: the indicators of a pane below the price are listed at that pane's own top, as on TradingView, not with the price pane's.
- One handle folds them all: the arrow under the legend hides every legend on the chart, the lower panes' too, and brings them back.
Legend
- Hide first, then settings: a row's buttons are now hide, settings and delete, in that order, larger, and in a box on the row you point at. Delete is a trash can.
On a phone
- Short rows: an indicator's row keeps its name and its first figure, so a long one such as VWAP with its bands no longer runs across the chart.
- A compact price line: the symbol and the bar's change on one line, and the open, high, low and close smaller on the next. The exchange and volume are left out.
Community showcase
- tradoor's own indicators, by @tradoor: all 18 built-ins written in Frost Script are on the showcase, after the community's scripts, each drawn live on its usual chart with its description and its source code. The page is never empty.
- Add one to your chart: a built-in's "Add to a chart in tradoor" puts it on your chart with its usual settings.
Self-hosting
- Analytics are Cloudflare's own: the build no longer adds an analytics tag, and the
CF_BEACONvariable is gone. On Cloudflare, turn on Web Analytics for the site with Automatic setup, and Cloudflare adds its tag to each page; the page's security policy allows it.
Full changes: v0.8.1...v0.8.2
Contributors

Assets 2
tradoor 0.8.1
Community scripts, a much fuller Frost Script, and a safer one.
Try it: https://tradoorterminal.com
Community scripts
- Three tabs in the indicator picker: Built-in, Community and My scripts, with one search across all three.
- Public or private: a script is yours alone until you make it public.
- A username of your own: chosen once in Settings, in place of your Telegram name, so you can stay anonymous. It is bound to your Telegram account for good, so a name on a script always means the same author.
- A description to share: a public script says what it shows and how to read it.
- The showcase: https://tradoorterminal.com/community.html shows every public script, drawn live by tradoor's own engine on the chart and settings it was shared from. No screenshots are kept. Open one to move around its chart and read its source, and add it to tradoor in a click.
Frost Script, much fuller
- Draws more: lines, labels and boxes you can move and change later, a table, background shading and candle colours. Plots take styles, offsets and a colour bar by bar.
- More language: texts, lists, functions of your own,
while,breakandcontinue, andfor … by. - Colours as
#rgb,#rrggbbor#rrggbbaa,rgb(…), andalpha(colour, 0.2). - Settings of every kind: tick boxes, colour pickers, choice menus and dates, besides numbers.
- 18 built-ins written in Frost Script, each giving the same numbers, with its source in Settings, Source: now also the EMA ribbon, EMA 200, volume, Ichimoku, anchored VWAP, the historical key levels, the swing structure map, trading sessions and moon phases. The six that read more than candles (liquidations, volume delta, the volume profile, VWAP levels, open interest and flow) say why they can't be scripts.
- Scripts from 0.8.0 keep working: a variable may share a built-in function's name, such as
rising,sumorlabel. - From Pine Script v6, with an AI: the instructions the editor copies are rewritten for the fuller language, with a whole worked conversion, so an AI chat turns complex indicators into Frost Script faithfully.
Safer
- No script can stop the server: one written to nest very deep could stop the server while it was being checked. How deep a script may go is now limited, and the server checks scripts on a thread of their own, four at a time.
- No script can hold up a chart: every operation now counts what it really costs, so a script that asks too much stops within a fraction of a second, on your chart and on the showcase.
- Bounded memory: a script keeps at most a million past values (8 MB) across its averages, windows and
[n].
Chart
- Settings with long names no longer overlap in the settings dialog.
- A script's legend shows its number settings, not its colours, dates and choices as raw numbers.
- Labels at the newest bar stay inside the chart instead of running under the price axis.
Self-hosting
- One migration (V40: public scripts, usernames, descriptions and previews) runs by itself when the server starts.
- The showcase is a second page,
web/community.html, built with the app; nothing to set up.
Full changes: v0.8.0...v0.8.1
tradoor 0.8.0
tradoor moves to its own address, and Frost Script, a language for indicators of your own, arrives.
Try it: https://tradoorterminal.com
tradoor has moved to tradoorterminal.com
- The new address: tradoor now lives at https://tradoorterminal.com. The old address, tradoor.rsalianto.com, sends every page on to the same page at the new one, so old links and bookmarks keep working.
- Your charts come with you: the move carries this browser's id across, so drawings, layouts, watchlists and settings open as you left them.
- Signed in with Telegram? Sign in once more: a sign-in is never carried from one address to another, so that no link can sign anyone into someone else's account. A note says so when you arrive. Your account, its layouts and its journal are all there once you sign in.
- Update your bookmark, and a shortcut on your home screen, to the new address.
Frost Script: indicators of your own
- A language of tradoor's own for indicators: a few readable lines that work out a value on every bar and draw lines, histograms, levels, fills and buy or sell marks, on the price chart or in a pane of their own, with settings like any built-in.
- Checked as you type: the editor names the line and column of a mistake, and a click takes you there.
- Every built-in's source: open an indicator's settings, then Source, to read it as Frost Script. SMA, EMA, Bollinger Bands, Keltner Channels, RSI, Stochastic RSI, MACD, ATR and VWAP give the same numbers as the built-ins, and they and a SuperTrend are in the editor's examples.
- Safe by what it is: tradoor's own engine in Rust works a script out, in a module that imports nothing. The language has no word for the network, the page or your account, and every loop and length has a limit, so a script someone else wrote can draw a wrong line at worst.
- Kept with your account: sign in with Telegram to write scripts, up to 100, on every device you sign in on.
- From Pine Script v6, with an AI: the editor copies instructions that teach an AI chat (Claude, ChatGPT, Gemini or another) Frost Script. Paste them, then a Pine Script v6 indicator, and it answers with the same indicator in Frost Script, saying what it could not carry over.
- The reference: the whole language, with examples and its limits, at https://tradoorterminal.com/doc.html
To start: Add an indicator, then New Frost Script.
Chart
- VWAP Levels, a new indicator: each period's VWAP and value area as labelled levels. It is worked out from hourly and daily bars, so a minute chart shows the year's levels too.
- Mouse wheel zoom, your choice: Settings, General, Mouse wheel zoom. In steps, the default, zooms a step for each notch at once. Smooth brings back the glide of 0.7.6. A trackpad and a pinch zoom smoothly either way.
- Crosshair price on top: the crosshair's price label now covers the badges on the price axis, instead of showing their text through it.
Economic calendar
- A late figure still comes in: when Nasdaq posts a figure late, as it did with November's PPI, the calendar keeps looking for it every minute for three hours. Before, it looked only every five minutes once twenty had passed.
Footprint
- Lighter's BTC footprint is recorded: the server records Lighter's BTC perpetual trades, so its footprint keeps history like Binance's, Bybit's and Hyperliquid's. The day before recording began is read back from Lighter once.
Announcements
- News from tradoor, atop the app: a short notice shows above the charts when there is something to know, such as this move. Close it, and it stays closed. A new one shows again.
Reliability
- Holding up under a crowd: with some 300 readers at once, database requests queued with no end, and accounts, drawings and footprints stopped loading. The server's database pools now have a size, and every request a time limit, so a busy moment slows things a little instead of stopping them.
Self-hosting
- Two migrations (V38, Frost Script's scripts, and V39, the announcement) run by themselves when the server starts.
- New, optional:
TRADOOR_ADMIN_KEY. Set it (openssl rand -hex 32) and/online.htmlopens with it: readers on screen, Telegram accounts, the server's state, every Frost Script to read, remove or restore, and the announcement. Unset, the page has nothing to read. To count readers, each tab on screen tells the server once a minute, by its browser id, and the server keeps that in memory only. - Database connections: the server opens at most 36 connections to PostgreSQL, 24 for requests and 12 for background work. PostgreSQL's default of 100 is enough.
- Lighter: the server now reads mainnet.zklighter.elliot.ai for Lighter's BTC trades, so it needs to reach it.
- Building:
scripts/build-wasm.shalso builds Frost Script's module intoweb/src/wasm/formula. The Dockerfile does it for you. - A new address of your own: set the repository variable
SITE_URLto it, as the README says. The client-side move inweb/public/moved.jsis written for tradoor's own two addresses and does nothing on any other.
Full changes: v0.7.6...v0.8.0
tradoor 0.7.6
A US economic calendar joins the workspace, a mouse wheel zooms smoothly, and touch screens are easier to draw on.
Try it: https://tradoor.rsalianto.com
Economic calendar
- A new panel, US Economic Calendar: the US releases with their forecast, previous and actual figures, and the FOMC's meetings. Times follow the time zone set in Settings. A strip at the top counts down to the next release. A figure is marked ▲ or ▼ against its forecast the moment it comes out.
- All, or the market movers: one switch narrows the list to CPI, PPI and the FOMC.
- A month back: past releases stay for 30 days, and the list runs three weeks ahead, with Fed meetings two months ahead.
- Refresh: one button goes back to now after a scroll and asks for today's figures again. However often it is pressed, the server asks Nasdaq at most once a minute.
Chart
- Smooth wheel zoom: each notch of a mouse wheel used to zoom by a fifth of the bars in a single jump. It now eases out over a fifth of a second and zooms just as far. A trackpad and pinch work as before.
Touch screens
- No crosshair while sliding: sliding the chart just moves it. The crosshair comes with a tap, or with a finger held still.
- Putting a drawing down: after a drawing such as a long position was picked, a tap beside it now lets it go. Before, it stayed picked until the chart was changed.
Self-hosting
No migration and no new settings. The server now reads the calendar in the background from api.nasdaq.com and federalreserve.gov, so it needs to reach both.
Full changes: v0.7.5...v0.7.6
tradoor 0.7.5
The watchlist keeps up with the chart and is there the moment the page is, and Hyperliquid's BTC footprint is recorded on the server.
Try it: https://tradoor.rsalianto.com
Watchlist
- Prices on every trade: on a desktop, Binance rows now follow each trade as a chart does, and are redrawn at most four times a second. Before, they waited for the daily candle, which Binance sends about once a second and at times five seconds late. Phones keep the lighter candle feed.
- Figures through a reload: the day's change and volume are kept in your browser for ten minutes, so a reload shows them at once rather than dashes until each coin next trades.
Connections
- A slow name lookup no longer costs an exchange: a computer whose first DNS server does not answer waits five seconds for it, and that was exactly how long tradoor gave a socket to open. One slow lookup closed the socket just as it was about to open and sent that exchange through the relay for five minutes. Sockets now get eight seconds.
Footprint
- Hyperliquid's BTC on the server: recorded from now on and kept for 30 days, for everyone, with no tab open. Hyperliquid's API answers only for its last ten trades, so earlier bars stay candles.
Self-hosting
No migration and no new settings. Your server starts recording the new market when it restarts.
Full changes: v0.7.4...v0.7.5
tradoor 0.7.4
The crosshair goes where a drawing's point will land, and on a phone a tap keeps it up to aim with.
Try it: https://tradoor.rsalianto.com
The magnet's crosshair
- On the point it will take: with the magnet on, the crosshair and its price on the axis stand on the bar's open, high, low or close, where the next anchor lands. Strong takes the nearest of them always, weak only when the pointer is near one (else a whole tick), and Ctrl held over no magnet is a weak one.
A crosshair for a finger
- A tap shows it, and it stays: sliding a finger anywhere on the chart moves it by the finger's motion, so the finger never covers the point, and the legend reads that bar. Another tap puts it away.
- Drawing by taps: with a tool chosen, tap for the crosshair, slide to aim it, and tap to place each point where it stands. The brush still draws under the finger, a tap on a drawing still picks it, and a held finger works as before.
Also
- The legend's prices apart from their letters: each of open, high, low and close keeps a dim letter and a gap, in the colour of its bar, as TradingView shows them.
Self-hosting
No migration and no new settings.
Full changes: v0.7.3...v0.7.4
tradoor 0.7.3
Draw on RSI, Stoch RSI, open interest and the other indicator panes, and chart pictures that say what they are of.
Try it: https://tradoor.rsalianto.com
Drawing in indicator panes
- Every tool but positions: trendlines, rays, the brush, fibs, rectangles, text and the rest go in the pane they start in (RSI and Stoch RSI, open interest, MACD and the others), on that pane's values. Long and short positions are priced, so they stay on the candles.
- Kept with its indicator: a drawing remembers its pane, hides when that indicator is taken off, and comes back with it.
Chart pictures
- Titled: the top left of a picture names the market, timeframe and exchange, the bar's prices and change, and when it was taken, or the replay's time.
- Brush strokes whole: a stroke no longer comes out of a picture in dashes.
Binance's limits
- Candles load again by themselves after Binance answers 429, counting down to when it may be asked again. Before, the chart stayed blank until the page was reloaded.
- The footprint says why it is not filling: when Binance refuses or limits this network (a VPN often does), the legend says so and when it tries again. The fill now takes at most a third of what Binance allows an address a minute, one call at a time across tabs, and stops while a chart is throttled.
Also
- Weekly VWAP on 1m and 5m charts: the chart loads back to the week's open, so the line no longer disappears as the week goes on.
- Footprint: the tradoor mark stands above the stats table, not on its row names.
Self-hosting
No migration and no new settings. A drawing in an indicator pane keeps its pane in its style.
Full changes: v0.7.2...v0.7.3
tradoor 0.7.2
The journal draws your trades back on the chart, each where it went.
Try it: https://tradoor.rsalianto.com
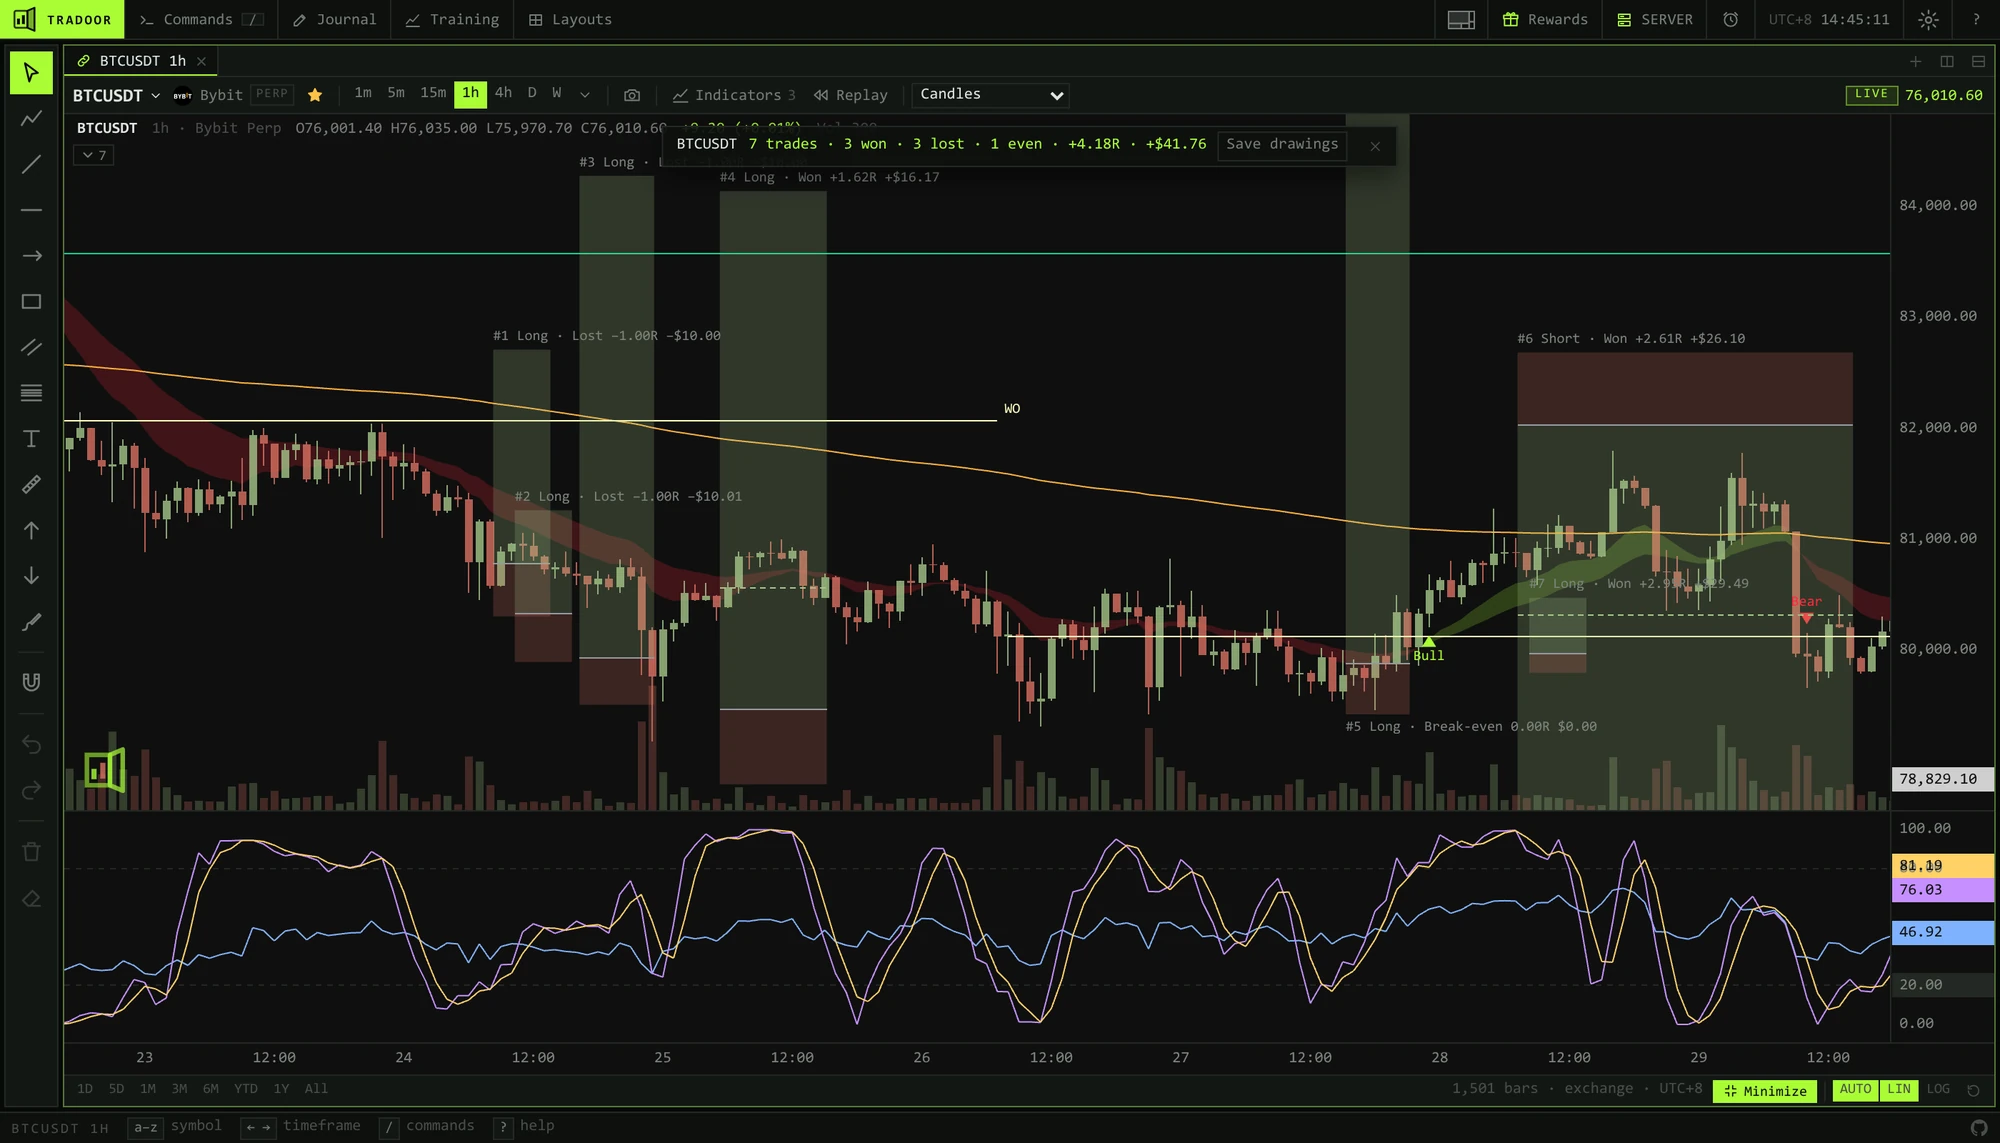
Show on chart
- From History: narrow the list to one pair, or click the pair in "Where it was made", and press Show on chart. The trades listed come back as long and short positions, each from when it was entered to when it closed.
- Numbered and labelled: in the order you took them, with how each went written over its box: won, lost or break-even, its R and its P&L. A bar over the chart totals them.
- Exits on the way to the stop or target, taken by hand or partly, show as dashed lines across the box.
- Framed for you: the chart opens at a bar length that shows them together, from the first entry to the last close. A close the record has at or before its entry is drawn an hour after it.
- Kept if you like: Save drawings leaves them on the chart as pictures of those trades. They are not new trades, and moving one changes nothing in the journal. Closing the bar leaves nothing behind.
Journal
- Prices at the market's decimals: the trade editor no longer fills a field with
0.0797612345where a position was dragged, or80311.69999999998where an average left a tail. A field left as it is saves nothing, so no price changes by being shown. - Decimals asked for again when the first asking failed, rather than falling back for the rest of the visit.
Self-hosting
No migration and no new settings. Your server no longer turns a saved picture of a trade into a trade of its own, nor ties one back to the trade it pictures.
Full changes: v0.7.1...v0.7.2