Transcriptome Contig Nx and ExN50 stats
Based on the lengths of the assembled transcriptome contigs, we can compute the conventional Nx length statistic, such that at least x% of the assembled transcript nucleotides are found in contigs that are at least of Nx length. The traditional method is computing N50, such that at least half of all assembled bases are in transcript contigs of at least the N50 length value.
The following script in the Trinity toolkit will compute these values for you like so:
  %  $TRINITY_HOME/util/TrinityStats.pl  Trinity.fasta

   ################################
   ## Counts of transcripts, etc.
   ################################
   Total trinity 'genes':	1388798
   Total trinity transcripts:	1554055
   Percent GC: 44.52

   ########################################
   Stats based on ALL transcript contigs:
   ########################################

Contig N10: 5264
Contig N20: 3136
Contig N30: 1803
Contig N40: 989
Contig N50: 606

Median contig length: 288
Average contig: 511.61
Total assembled bases: 795066996
The N10 through N50 values are shown computed based on all assembled contigs. In this example, 10% of the assembled bases are found in transcript contigs at least 5,264 bases in length (N10 value), and the N50 value indicates that at least half the assembled bases are found in contigs that are at least 606 bases in length.
The contig N50 values can often be exaggerated due to an assembly program generating too many transcript isoforms, especially for the longer transcripts. To mitigate this effect, the script will also compute the Nx values based on using only the single longest isoform per 'gene':
  #####################################################
  ## Stats based on ONLY LONGEST ISOFORM per 'GENE':
  #####################################################

Contig N10: 3685
Contig N20: 1718
Contig N30: 909
Contig N40: 588
Contig N50: 439

Median contig length: 281
Average contig: 433.39
Total assembled bases: 601896081
You can see that the Nx values based on the single longest isoform per gene are lower than the Nx stats based on all assembled contigs, as expected, and even though the Nx statistic is really not a reliable indicator of the quality of a transcriptome assembly, the Nx value based on using the longest isoform per gene is perhaps better for reasons described above.
An alternative to the Contig Nx statistic that could be considered more appropriate for transcriptome assembly data is the ExN50 statistic. Here, the N50 statistic is computed as above but limited to the top most highly expressed transcripts that represent x% of the total normalized expression data. This can be computed like so:
% $TRINITY_HOME/util/misc/contig_E_statistic.pl transcripts.TMM.EXPR.matrix Trinity.fasta | tee ExN50.stats
which will generate a data table like so:
| #E | min_expr | E-N50 | num_transcripts |
|---|---|---|---|
| E2 | 89129.251 | 2397 | 1 |
| E3 | 89129.251 | 2397 | 2 |
| E5 | 66030.692 | 2397 | 3 |
| E6 | 66030.692 | 2397 | 4 |
| E8 | 66030.692 | 2397 | 5 |
| ... | ....... | ...... | .... |
| E80 | 23.277 | 2685 | 5593 |
| E81 | 20.940 | 2735 | 6331 |
| E82 | 17.854 | 2786 | 7183 |
| E83 | 15.257 | 2817 | 8173 |
| E84 | 12.494 | 2878 | 9327 |
| E85 | 10.241 | 2952 | 10687 |
| E86 | 9.187 | 3056 | 12309 |
| E87 | 7.044 | 3149 | 14261 |
| E88 | 6.136 | 3261 | 16646 |
| E89 | 4.538 | 3351 | 19635 |
| E90 | 3.939 | 3457 | 23471 |
| E91 | 3.077 | 3560 | 28583 |
| E92 | 2.208 | 3655 | 35832 |
| E93 | 1.287 | 3706 | 47061 |
| E94 | 0.827 | 3658 | 66696 |
| E95 | 0.439 | 3444 | 104654 |
| E96 | 0.280 | 3109 | 171732 |
| E97 | 0.235 | 2683 | 275376 |
| E98 | 0.164 | 2163 | 428285 |
| E99 | 0.128 | 1512 | 668589 |
| E100 | 0 | 606 | 1554055 |
Plotting the Ex value (first column) against the ExN50 value, we see:
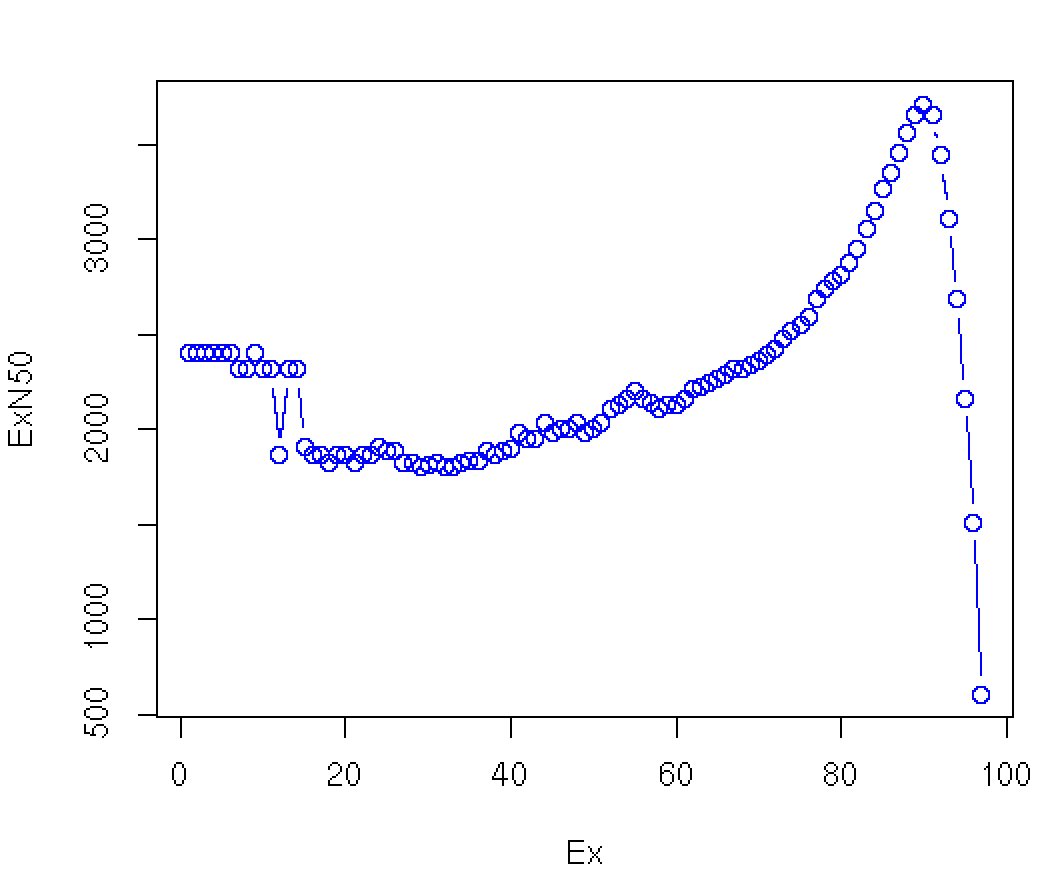
Note that our original contig N50 value is 606 bases, and involves all the contigs (E100), but in excluding the many lowly expressed contigs (which tend to also be very short given that low read coverage confounds assembly), most N50 calculations would be substantially greater, ranging from ~2.4 kb to ~3.5 kb. The maximum value is found near E90 in this data set. Instead of reporting N50 values that discard read coverage information, we assert the E90N50 value as a more useful indicator of transcriptome assembly quality.