Transcriptome Contig Nx and ExN50 stats
Below we describe Trinity toolkit utilities for computing contig Nx statistics (eg. the contig N50 value), in addition to a modification of the Nx statistic that takes into consideration transcript expression (read support) data, which we call the ExN50 statistic.
Based on the lengths of the assembled transcriptome contigs, we can compute the conventional Nx length statistic, such that at least x% of the assembled transcript nucleotides are found in contigs that are at least of Nx length. The traditional method is computing N50, such that at least half of all assembled bases are in transcript contigs of at least the N50 length value.
The following script in the Trinity toolkit will compute these values for you like so:
  %  $TRINITY_HOME/util/TrinityStats.pl  Trinity.fasta

   ################################
   ## Counts of transcripts, etc.
   ################################
   Total trinity 'genes':	1388798
   Total trinity transcripts:	1554055
   Percent GC: 44.52

   ########################################
   Stats based on ALL transcript contigs:
   ########################################

Contig N10: 5264
Contig N20: 3136
Contig N30: 1803
Contig N40: 989
Contig N50: 606

Median contig length: 288
Average contig: 511.61
Total assembled bases: 795066996
The N10 through N50 values are shown computed based on all assembled contigs. In this example, 10% of the assembled bases are found in transcript contigs at least 5,264 bases in length (N10 value), and the N50 value indicates that at least half the assembled bases are found in contigs that are at least 606 bases in length.
The contig N50 values can often be exaggerated due to an assembly program generating too many transcript isoforms, especially for the longer transcripts. To mitigate this effect, the script will also compute the Nx values based on using only the single longest isoform per 'gene':
  #####################################################
  ## Stats based on ONLY LONGEST ISOFORM per 'GENE':
  #####################################################

Contig N10: 3685
Contig N20: 1718
Contig N30: 909
Contig N40: 588
Contig N50: 439

Median contig length: 281
Average contig: 433.39
Total assembled bases: 601896081
You can see that the Nx values based on the single longest isoform per gene are lower than the Nx stats based on all assembled contigs, as expected, and even though the Nx statistic is really not a reliable indicator of the quality of a transcriptome assembly, the Nx value based on using the longest isoform per gene is perhaps better for reasons described above.
An alternative to the Contig Nx statistic that could be considered more appropriate for transcriptome assembly data is the ExN50 statistic. Here, the N50 statistic is computed as above but limited to the top most highly expressed genes that represent x% of the total normalized expression data. The gene expression is take as the sum of the transcript isoform expression and the gene length is computed as the expression-weighted mean of isoform lengths. This calculation requires that you've first performed transcript abundance estimation, and can then be computed like so:
 %  $TRINITY_HOME/util/misc/contig_ExN50_statistic.pl \
     transcripts.TMM.EXPR.matrix Trinity.fasta transcript | tee ExN50.transcript.stats
which will generate a data table like so:
| Ex | ExN50 | num_genes |
|---|---|---|
| 2 | 2397 | 1 |
| 4 | 2397 | 2 |
| 5 | 2397 | 3 |
| 7 | 869 | 4 |
| 8 | 2397 | 5 |
| ... | ...... | .... |
| 80 | 2747 | 6577 |
| 81 | 2788 | 7499 |
| 82 | 2846 | 8578 |
| 83 | 2898 | 9848 |
| 84 | 2878 | 9908 |
| 85 | 2952 | 10687 |
| 86 | 3056 | 12309 |
| 87 | 3149 | 14261 |
| 88 | 3261 | 16646 |
| 89 | 3351 | 19635 |
| 90 | 3457 | 23471 |
| 91 | 3560 | 28583 |
| 92 | 3655 | 35832 |
| 93 | 3706 | 47061 |
| 94 | 3658 | 66696 |
| 95 | 3444 | 104654 |
| 96 | 3109 | 171732 |
| 97 | 2683 | 275376 |
| 98 | 2163 | 428285 |
| 99 | 1512 | 668589 |
| 100 | 606 | 1554055 |
Plotting the Ex value (first column) against the ExN50 value:
${TRINITY_HOME}/util/misc/plot_ExN50_statistic.Rscript  ExN50.transcript.stats

xpdf ExN50.transcript.stats.plot.pdf
we see:
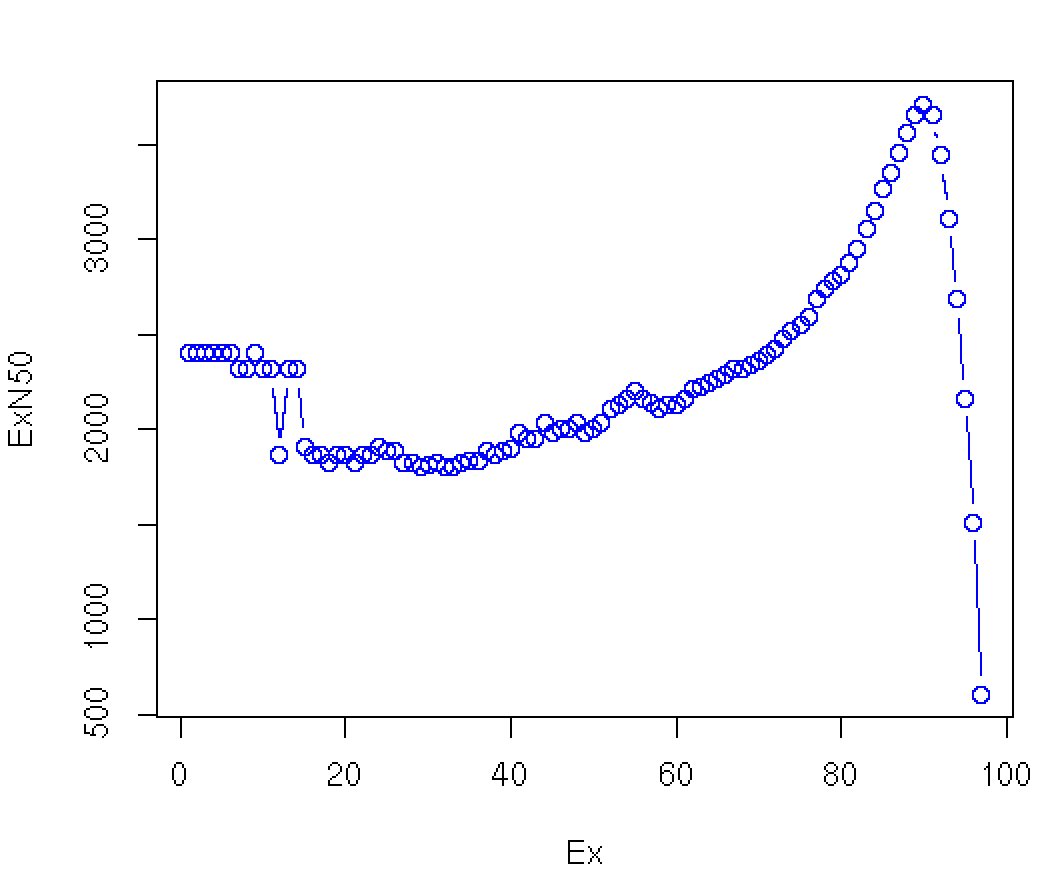
Note that our original contig N50 value is 606 bases, and involves all the contigs (E100), but in excluding the many lowly expressed contigs (which tend to also be very short given that low read coverage confounds assembly), most N50 calculations would be substantially greater, ranging from ~2.4 kb to ~3.5 kb. The maximum value is found near E90 in this data set. Instead of reporting N50 values that discard read coverage information, we assert the E90N50 value (3.5kb in this example) ** as a more useful indicator of transcriptome assembly quality than the N50 ** (606 bases here).
When you ran the 'contig_ExN50_statistic.pl' script above, in addition to writing the 'ExN50.stats' file, it wrote a file 'transcripts.TMM.EXPR.matrix.E-inputs', which identifies each transcript and the Ex interval in which it falls, with genes ordered in descending order of expression level:
#Ex  acc            length  max_expr_over_samples  sum_expr_over_samples
2    c1088733_g1    2397    61853.2                642652.7
4    c1020875_g2    839     172277.2               619738.8
5    c1083417_g1    770     45823.5                496390.5
7    c1069424_g1    869     112348.1               435975.2
8    c1088639_g4    2817    145443.3               359870.0
9    c1090169_g1    2315    157611.9               331648.0
10   c1073591_g9    1825    246668.3               255170.6
11   c1084180_g1    508     21320.8                253294.5
11   c1083535_g6    4287    170837.5               239750.9
12   c1087214_g4    1290    45141.5                239016.0
...
If you want to know, how many genes correspond to the Ex 90 peak, you could:
cat transcripts.TMM.EXPR.matrix.E-inputs | egrep -v ^\# | awk '$1 <= 90' | wc -l
.
23471
And so the E90 number of genes (23,471) for which the E90N50 value is computed is just a fraction of the total number of genes (1,554,055) with isoforms assembled and for which the N50 statistic was based.
if you run the 'contig_ExN50_statistic.pl' script with 'gene' as the target, then you will generate a separate gene-based E-inputs output file. Either (or both) can be used in further exploration below.
The profile of Ex vs. N50 value can be useful indicator as to the overall quality of the assembly. For example, below is a plot showing the profiles for data sets assembled using a very tiny number of reads up to a number sufficient to derive a quality assembly:
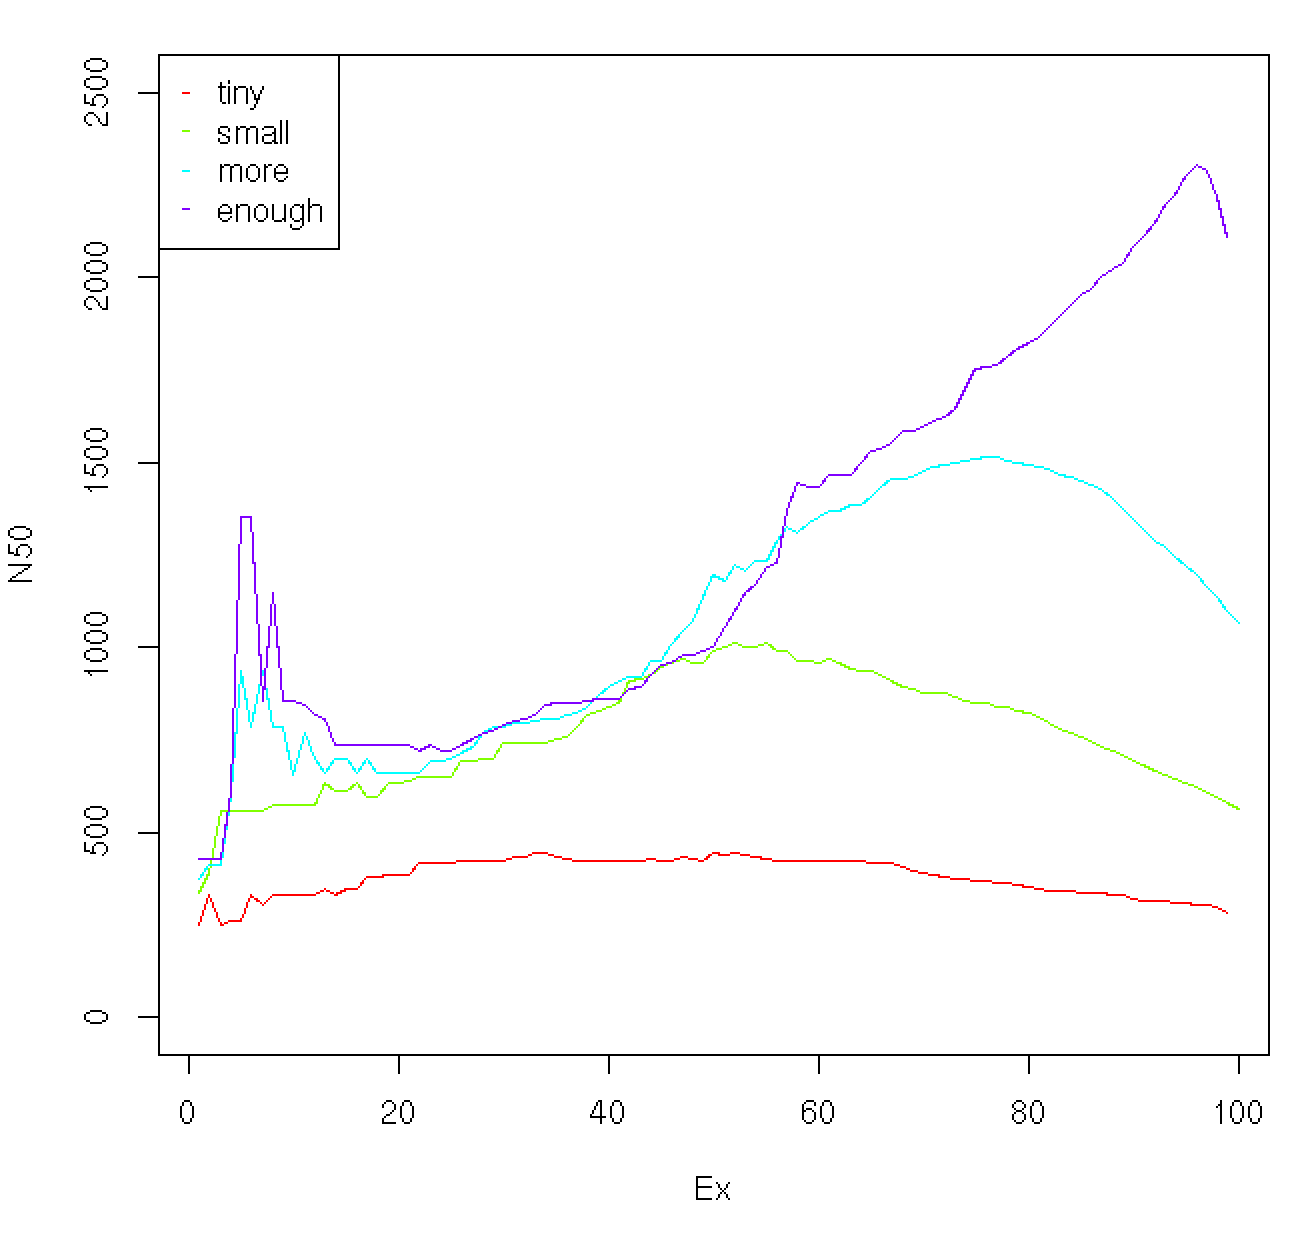
As the read depth is increased, the ExN50 peak begins to shift towards ~90%. In addition to exploring saturation of full-length reconstructed transcripts as a function of read depth, the ExN50 profiles can provide a useful guide towards understanding whether deeper sequencing might be expected to provide for a higher quality assembly.
Note, 'genes' can be used in the ExN50 statistic rather than the individual transcripts. This is because there are some lowly expressed transcripts that can end up with small expression values among genes where other long isoforms are assigned most of the reads and have high expression levels. Such cases can bias a transcript-based ExN50 statistic. Performing the analysis at the gene levels removes this bias and is more useful. To run at the 'gene' level, run like so:
 %  $TRINITY_HOME/util/misc/contig_ExN50_statistic.pl \
         transcripts.TMM.EXPR.matrix Trinity.fasta gene | tee ExN50.gene.stats

followed by plotting:

    ${TRINITY_HOME}/util/misc/plot_ExN50_statistic.Rscript  ExN50.gene.stats

    xpdf ExN50.gene.stats.plot.pdf
Using the '*.E-inputs' file produced during the contig ExN50 profiling above, you can explore estimating the TPM threshold that would separate substantially expressed transcripts (or genes) from those that are the lowly expressed transcripts. This is done by ordering transcripts (or genes) according to expression value and plotting their ranking (from low to hi) (y-axis) according to their expression (log2 expression) (x-axis), and finding the point that represents the elbow of the curve as a way of partitioning the lowly and more substantially expressed features. This can be explored like so:
    ${TRINITY_HOME}/util/misc/try_estimate_TPM_filtering_threshold.Rscript --E_inputs transcripts.TMM.EXPR.matrix.E-inputs

    xpdf estimate_TPM_threshold.pdf
An example of such a plot is below:
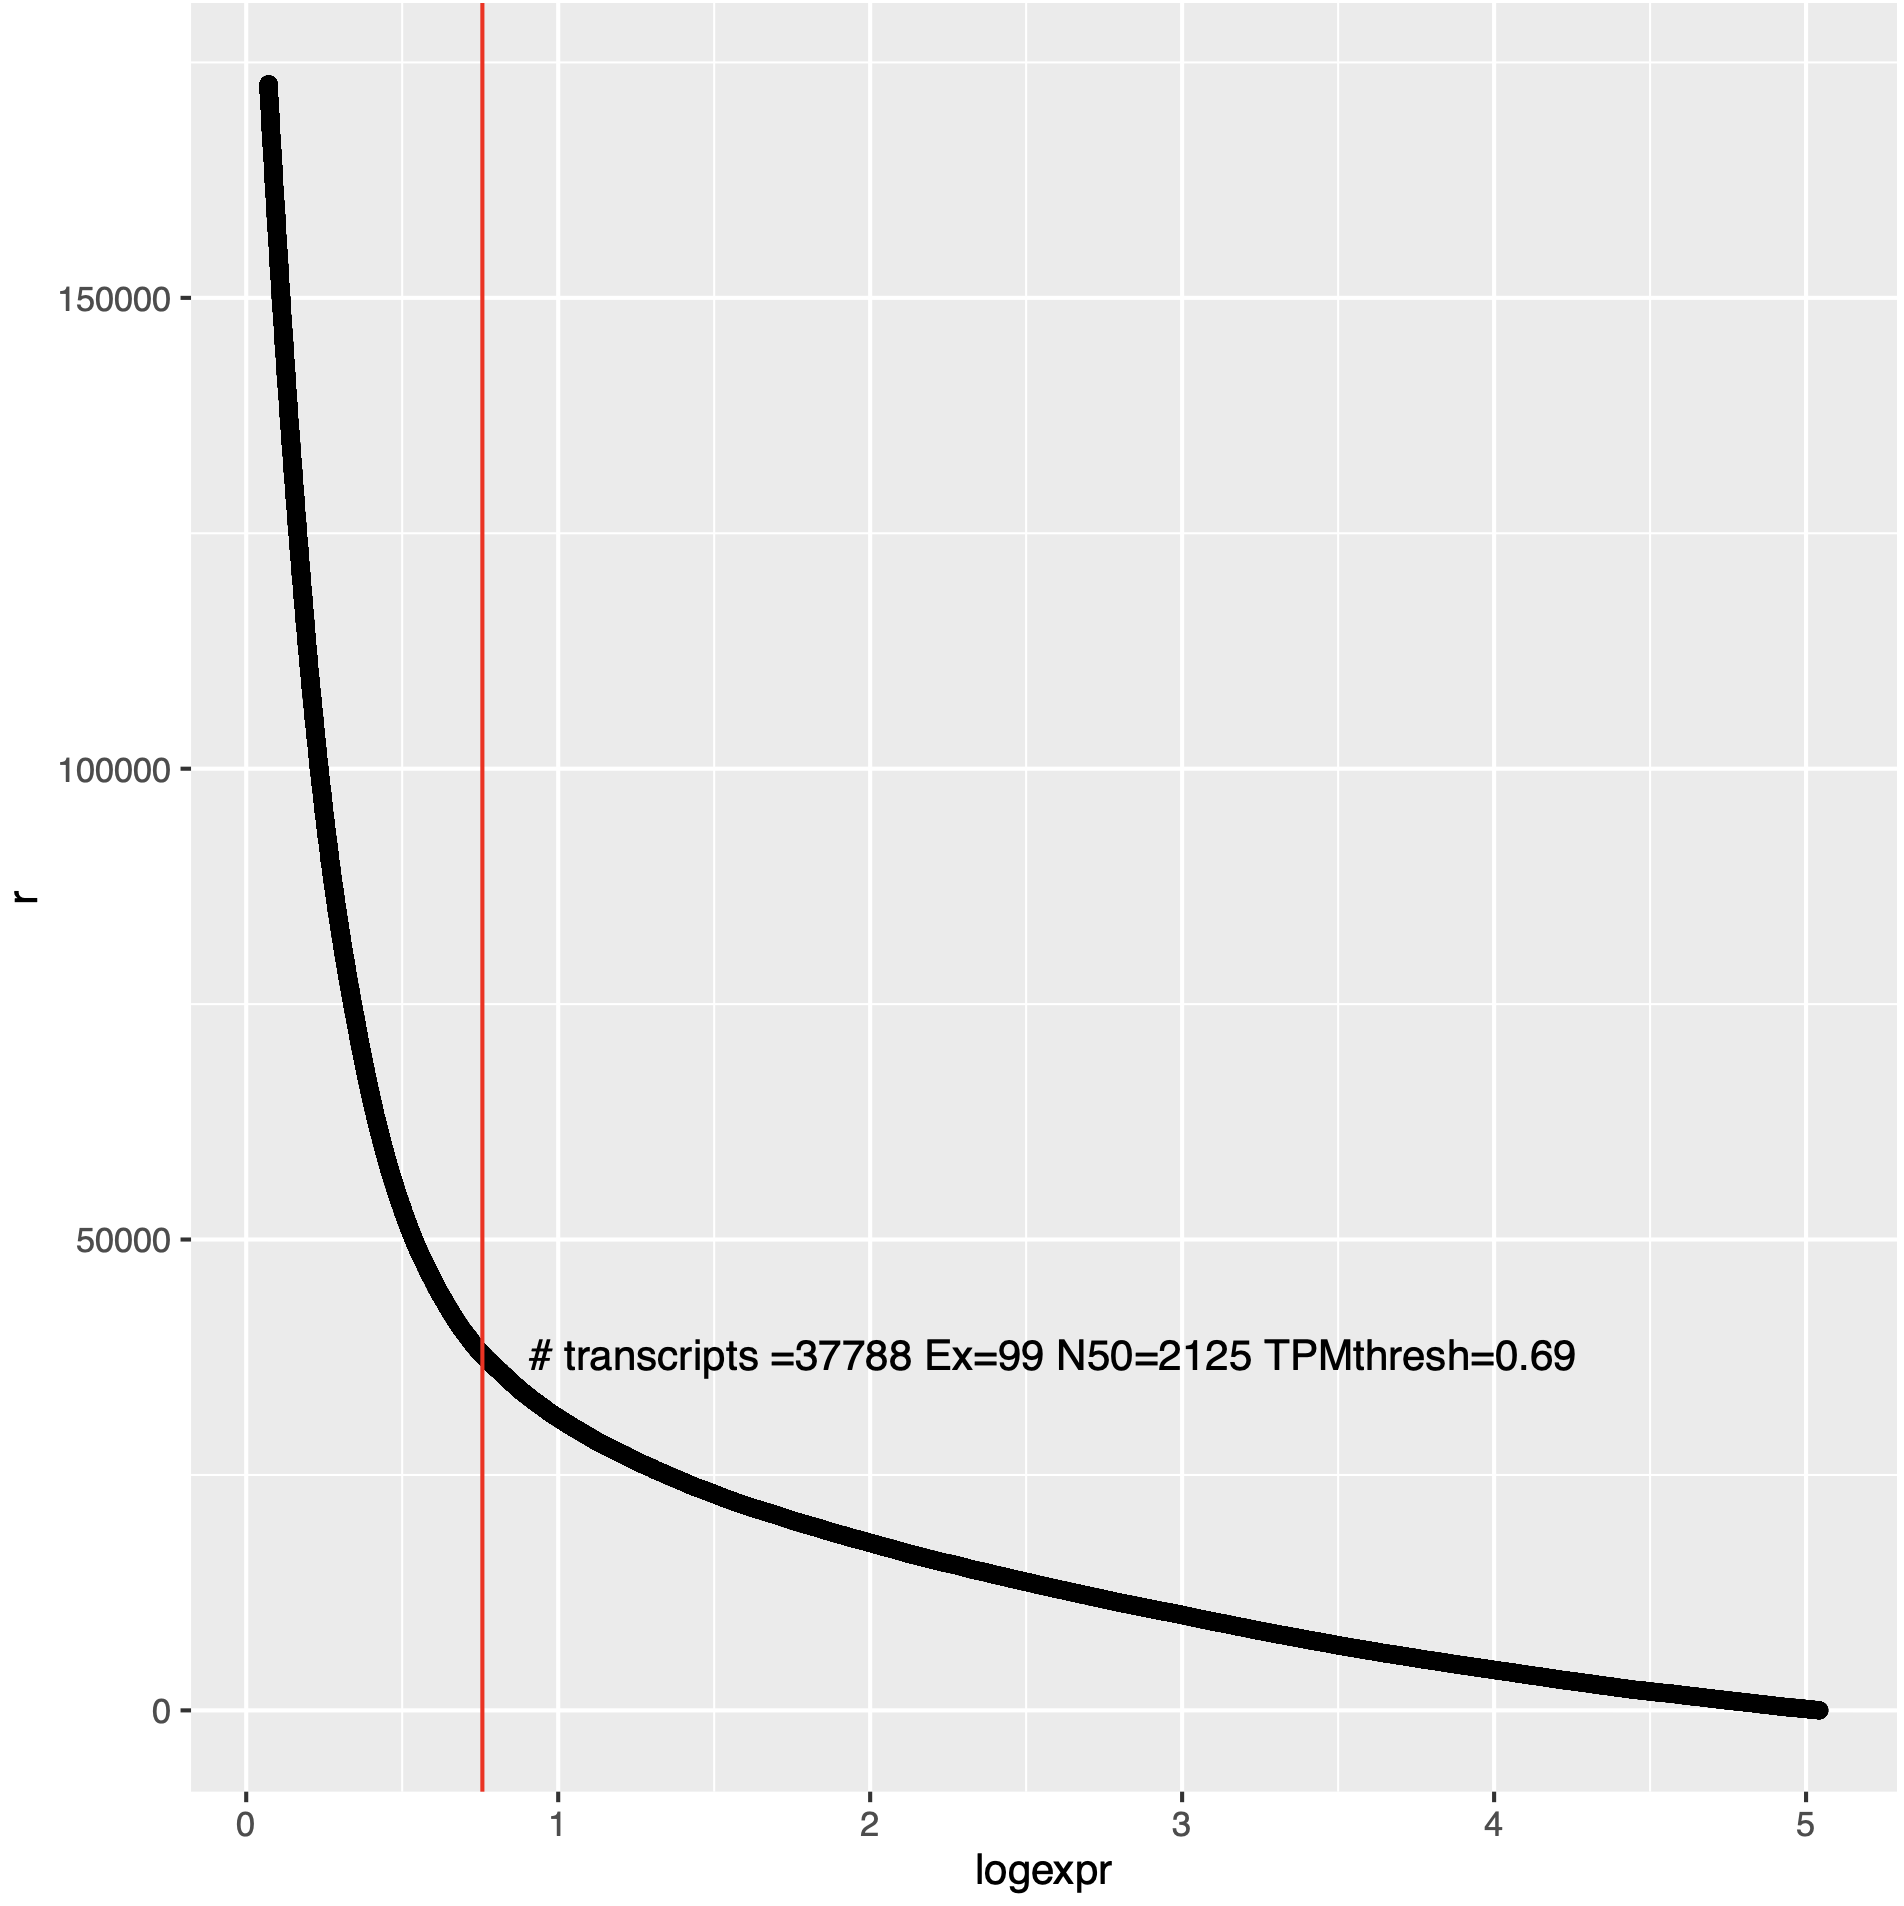
In the above plot, 'r' (x-axis) is the ranking of the transcript as ordered from low to high expression value, and the y-axis indicates the log2(TPM + 1) for corresponding transcripts (or genes).
Note, the above estimator is just exploratory and can often be helpful. If your data look very different and your estimated TPM thresholding value is far greater than 1 TPM, then be skeptical.