Performance Tests
Apache JMeter was the testing tool used for analyzing and measuring the performance of the MDA component. This tool simulates a group of tenants sending requests to a target server, and returns statistics that show the functionality of the target server/application via tables. For performance purposes, the dynamic features were the number of monitoring specs, the monitored metrics, and finally the number of active threads running/listening on our system. Next, we display those tests, divided by scenarios, and their corresponding results:
- Scenario A: increase the number of metrics inside a certain monitoring spec
- Scenario B: increase the number of monitoring specs with a set number of metrics
| Scenario | Version | # Monitoring Specs | # Metrics | # Threads | # Failed | Bytes | Send Bytes | Latency (ms) | Connect Time (ms) | Memory Usage (%) | Max CPU Usage (%) |
|---|---|---|---|---|---|---|---|---|---|---|---|
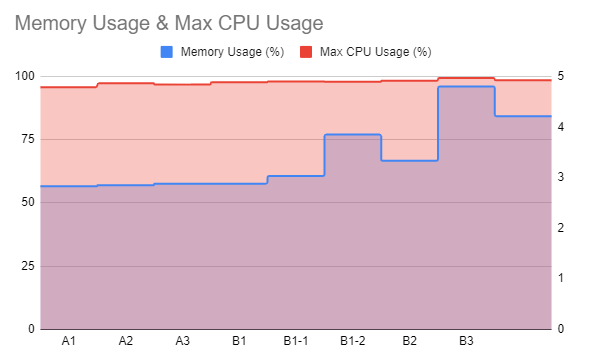
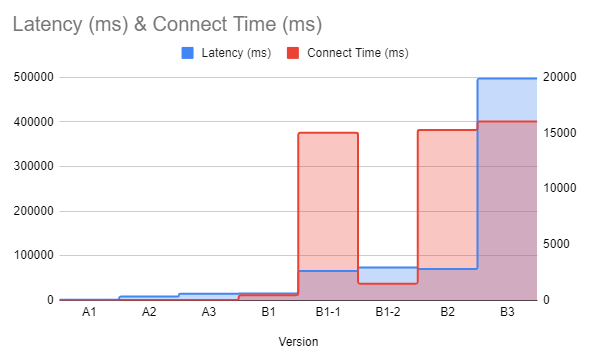
| A | A1 | 1 | 100 | 10 | 0 | 13244 | 12831 | 1775 | 35 | 2.83 | 95.7 |
| A2 | 1 | 500 | 10 | 0 | 65244 | 59632 | 8789 | 30 | 2.85 | 97.21 | |
| A3 | 1 | 1000 | 10 | 0 | 130247 | 119134 | 15170 | 31 | 2.88 | 96.78 | |
| B | B1 | 10 | 100 | 10 | 0 | 13244 | 12831 | 15731 | 460 | 2.88 | 97.67 |
| B1-1 | 10 | 500 | 10 | 0 | 65244 | 59632 | 65927 | 15032 | 3.03 | 97.92 | |
| B1-2 | 10 | 500 | 100 | 0 | 65244 | 59632 | 74101 | 1490 | 3.85 | 97.89 | |
| B2 | 100 | 100 | 10 | 0 | 13244 | 12831 | 70208 | 15284 | 3.33 | 98.2 | |
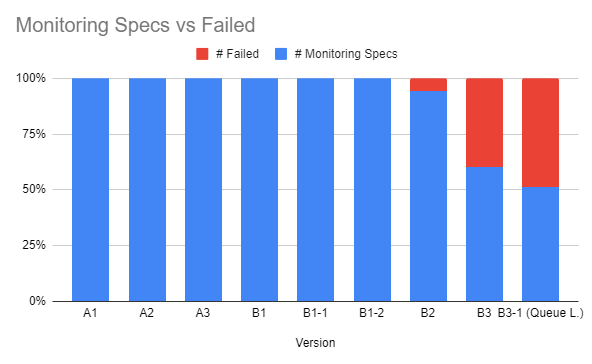
| B3 | 1000 | 100 | 10 | 662 | 13244 | 12831 | 497171 | 16047 | 4.8 | 99.3 | |
| B3-1 | 1000 | 100 | 100 | 948 | NA | NA | NA | NA | 4.21 | 98.4 |

This page holds an early description of MDA. This component is under the responsibility of Altice Labs, with supervision of André Gomes & Bruno Santos. Please use the GitHub issues to report bugs or contact the development team through 5GZorro's Slack channel.