Hi,
Here are the code(written in R) and thoughts of some statistics and data mining of the React game data.

React, the game (https://goo.gl/BvL9S2), is a independent mobile game made with ♥ as a side project on the free time between college and 9-5 job. It's a game about "quick reactions" where you need to match the shape on the center with your corresponding shape on one of the sides. Check it out on the google play if you've never heard about it, the reading of this analysis will be much more clean after this.
On the beginning, React was imagined to adapt your "difficulty" to your users, in other words, as long as a user get better on React it will become harder and as long as a user struggle to reach some milestone React become easier. Pretty cool, no?
But we have a problem, as long as we don't have any data about how users will behave inside React's mechanics we cannot predict how React engine should behave to adapt itself, and the solution for this was release React and then collect the data to make it intelligent. Because of this React was released as an "Alpha/Beta" version some time ago and now, with some data in hands, and after lots of fixed bugs and interface redesigns we can go through this process and make the awesomeness of react's mind happen! 🚀
React's mind will adapt the game so the user can reach some specific milestone with some specific effort. For example, let's say that a fun React play is when you can reach the 3rd dimension before things start to get insane, so React need to comprehend when it needs to change your own environment so people can reach the 3rd dimension with a relative medium effort. To summarize this concept, let's say that for every 100 plays only 15 of these plays can reach the 3rd dimension, so React needs to get a bit easier to be fun to play, and in the other hand if for every 100 plays 70 of these pass through the 3rd dimension means that react user is getting experienced and it's time to get a bit harder to be fun.
We can construct such intelligence with just some simple data from how users play React, like how much games have they played, average score, average time playing, etc. but as long as this study progress you will see how much information such simple data can carry. Everytime a React user finish a play we collect some data from their run, like the score, time playing on that run and some other things, after that, the data is sent to our NodeJS server API and stored on a MongoDB database so we can analyze them later and React players can have a "Global Highscore" feature to know how they perform versus another players.
To create a powerfull engine for React's brain just a bunch of data isn't enough, we need to extract the gold from this soil, and for this "extraction" our pickaxe were metamorphosed in R, a well rooted programming language in the field of statistical computing and graphics.
Since R is out for a long time now we have a lot of usefull libraries on the web to use, a lot of content on stackoverflow to answer our questions and a lot of free courses avaiable over the internet, so it wasn't a pain at all to learn and apply R on this project.
With the right tools in hands and fresh data from our users we can start the mining.
*all the data, numbers and graphs used below are avaiable in this repository within the code to reproduce them;**the data provided as date or time will be presented as +00:00 UTC but will be discussed as -3 GMT since 80% of React players came from this time zone;**all the graphs presented here can be found in the ./Plots folder in this repository;*
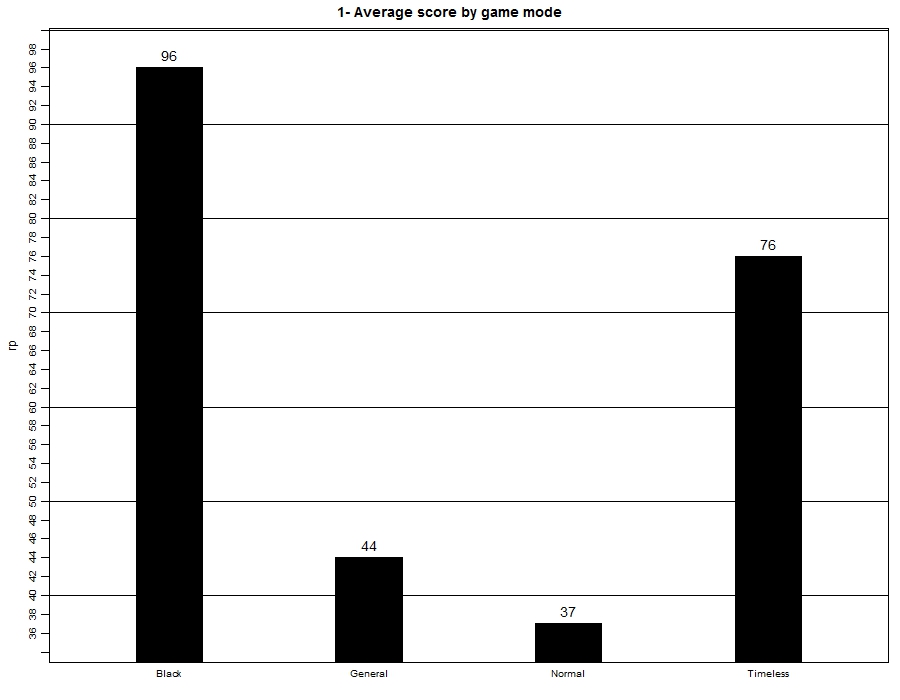
So in a global average the React user scores 44rp, this isn't good at all, the 3rd dimension started just after the 30rp and the "insanity" level of React starts at >90rp, people are getting struggled just after the 3rd dimension appears, is React is too hard?
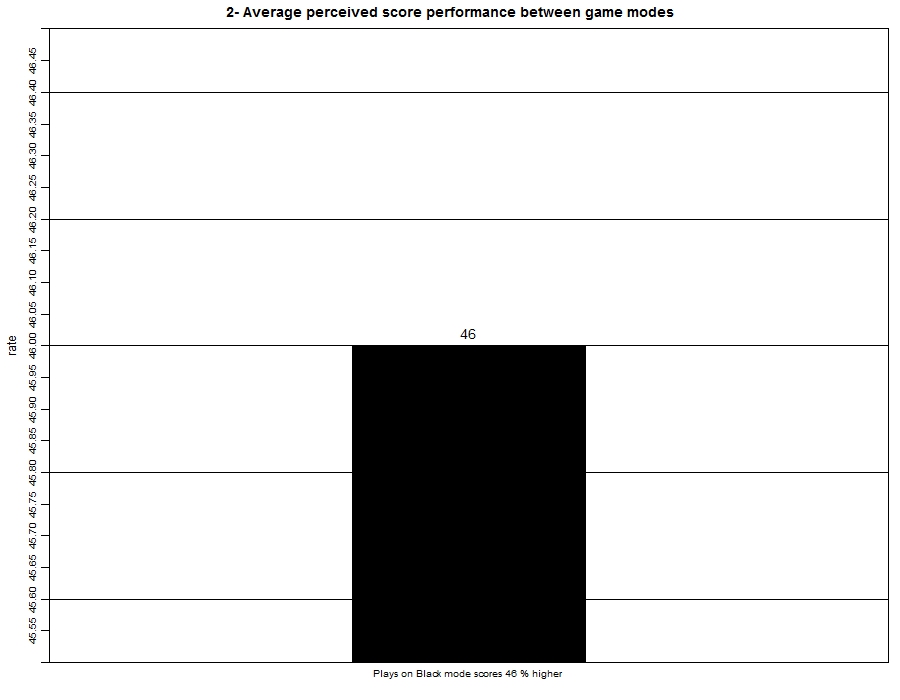
Another curious thing here is that games on Black mode scores an average of 46% more than the General average score. Curious. Is the brain more confortable to identify shapes and colors in a "darker" environment?
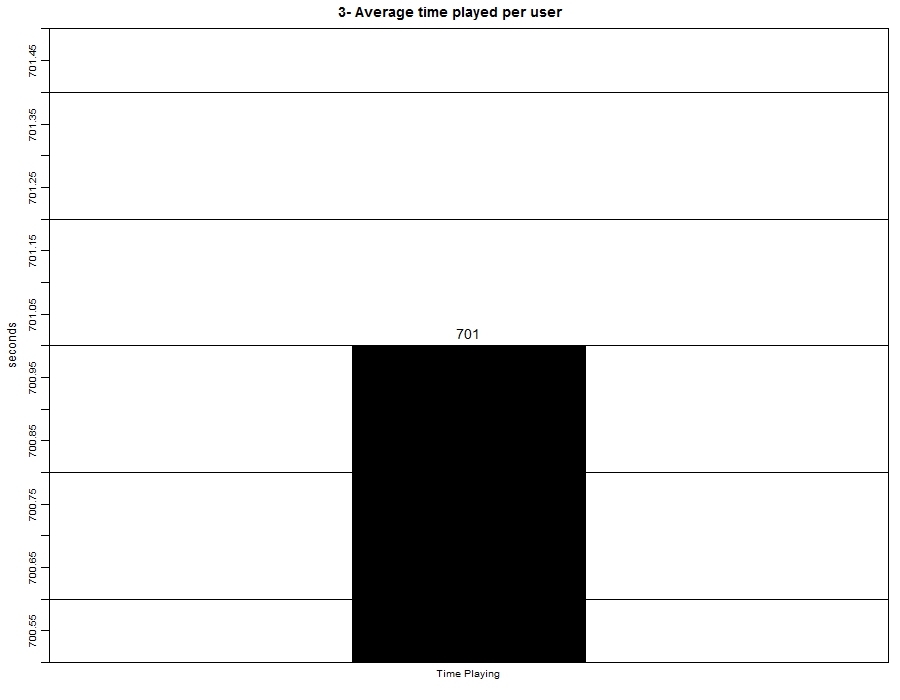
701 seconds, or 11.6 minutes, is the average time that some one have passed playing on React
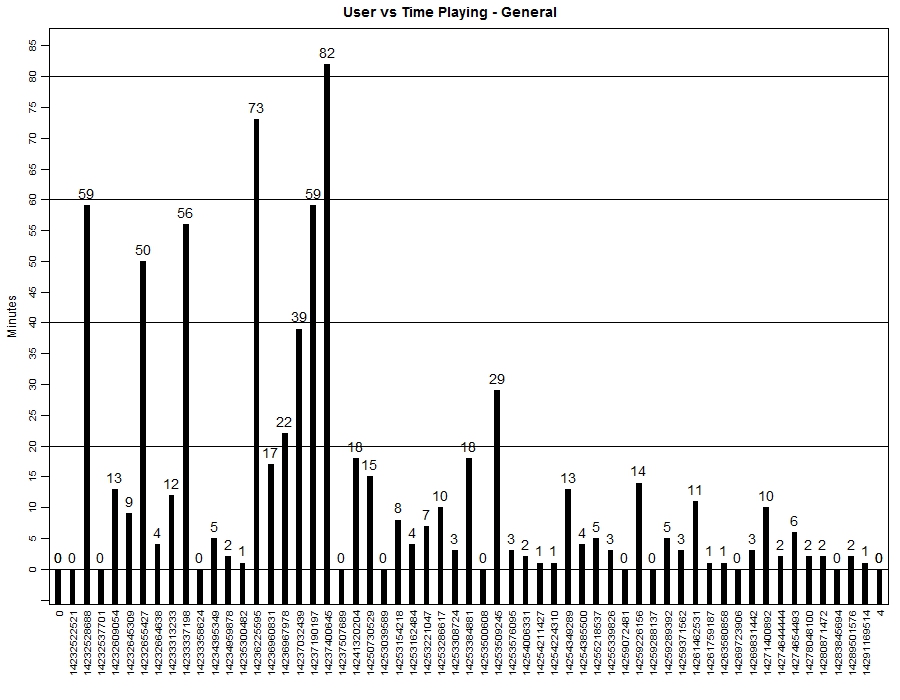
*For curiosity, the user that have spended more time playing React have a milestone of 82 minutes, or 1.36 hous, that's a lot of time, thanks for the appreciation.
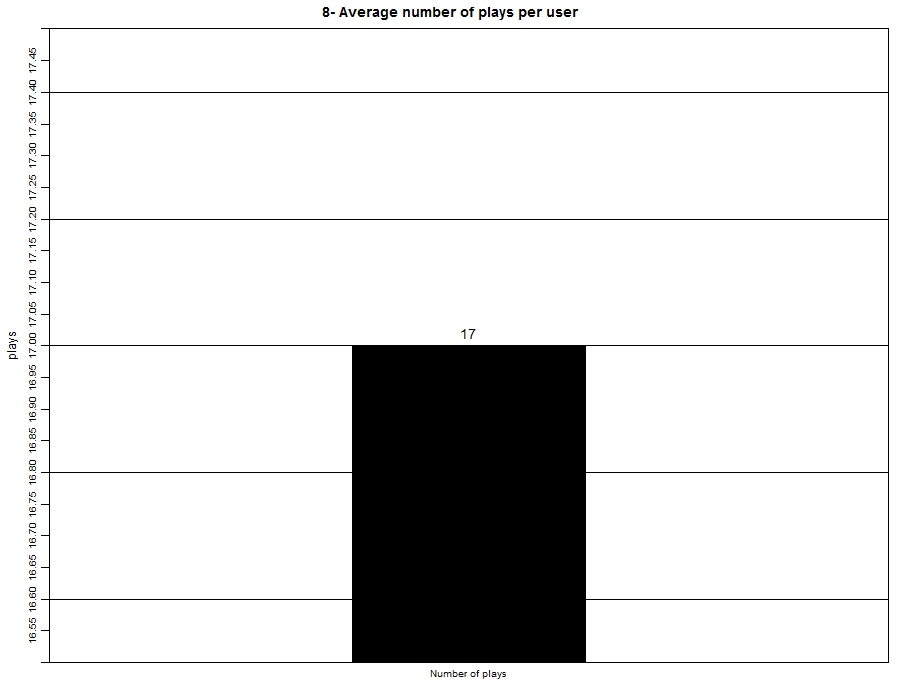
In average a React user plays 17 games.
So we know that an average React player have spended 11.6 minutes playing in 17 plays and got an average of 44rp
Now that we know how a average React user behaves we can say to the engine how he should behave to users have fun games. Soon we will code in React's mind and after it's lock and load we'll publish it on GitHub too and so we can demonstrate how all this data helps the process. Stay tuned;
All this work was made with ❤️ by Gabriel "Age" Rodrigues and React team
Following the study progress i will write down here the news oberved
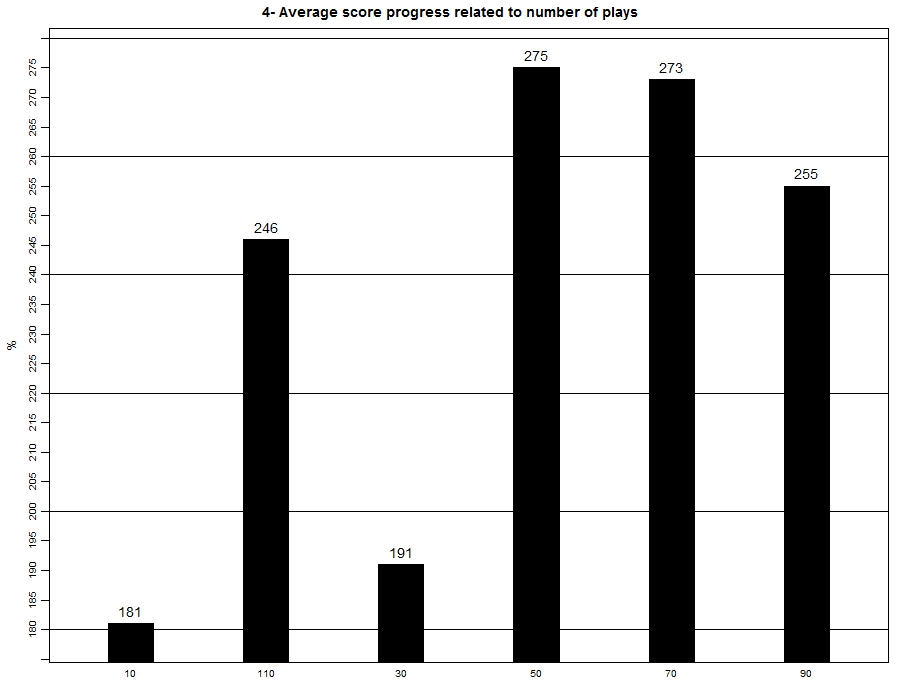
The average score of people that play more than 50 times is 275% greater than the average of those who plays less than 50 times. Wow.
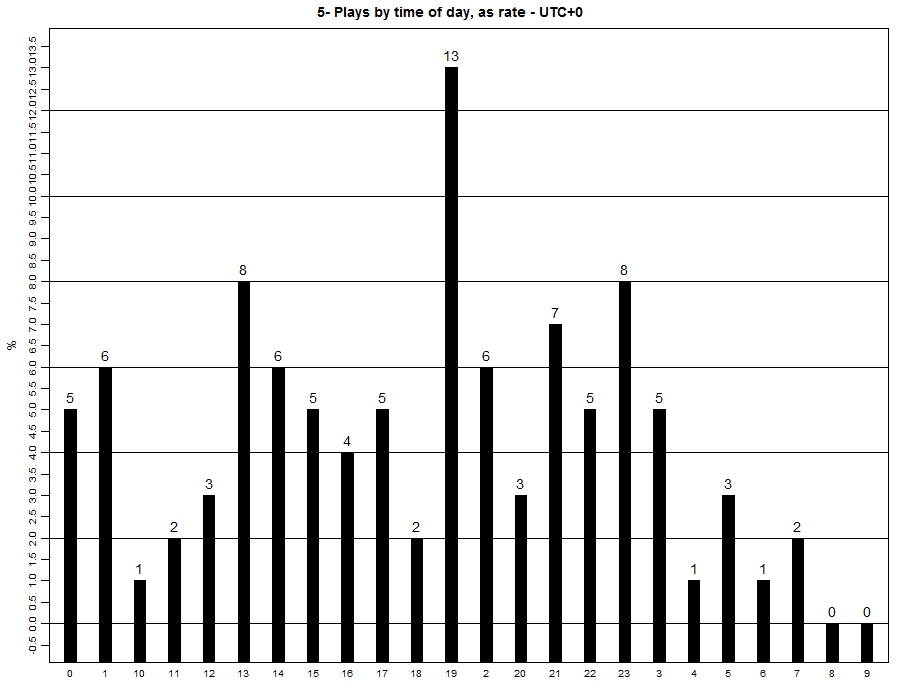
43% of all React plays was made in between 10 and 15 hours(-3GMT), with a special look at the 15hr that holds 13% of all React plays alone.
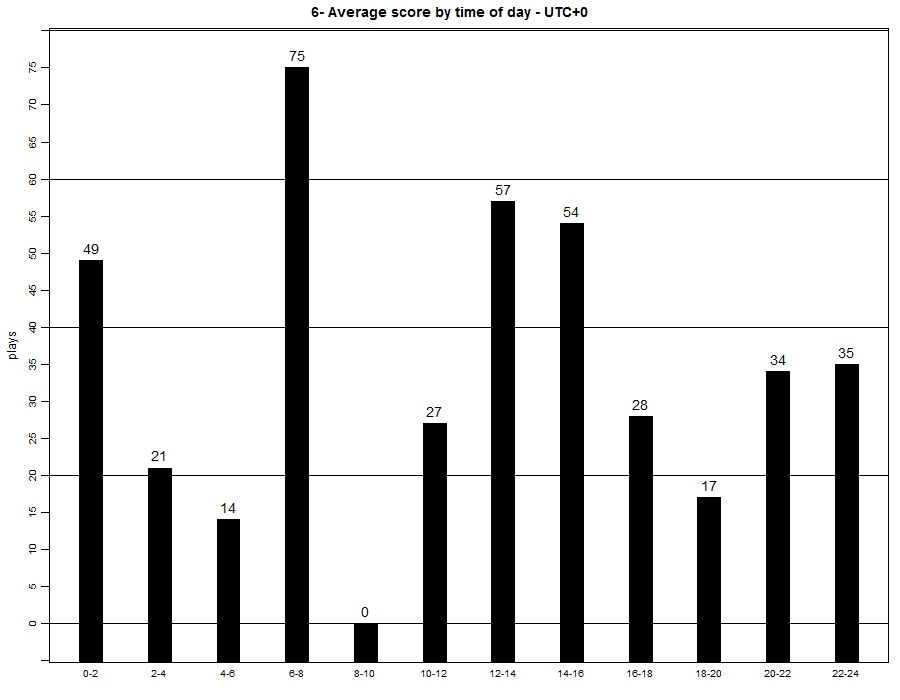
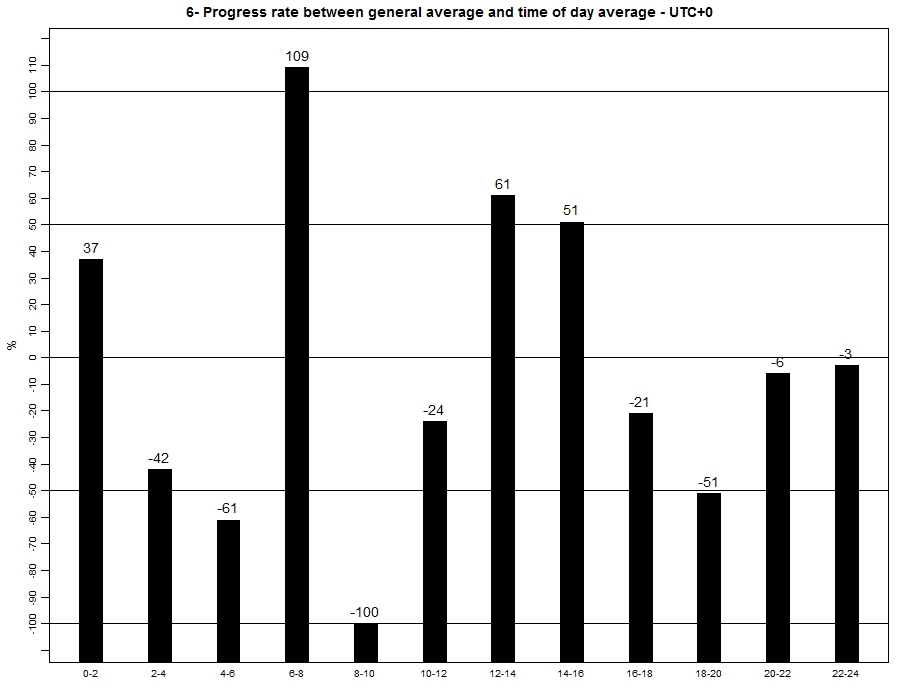
But in the other hand plays who happen between 15-18hr(-3GMT) have an average score of only 17rp, while the games in between 3-5hr have an average score of 75rp. We can say that Owls are the best React players.
So we can say that games that happens between 3-5hr(-3GMT) scores an average of 109% more than the general score average. Pretty weird.
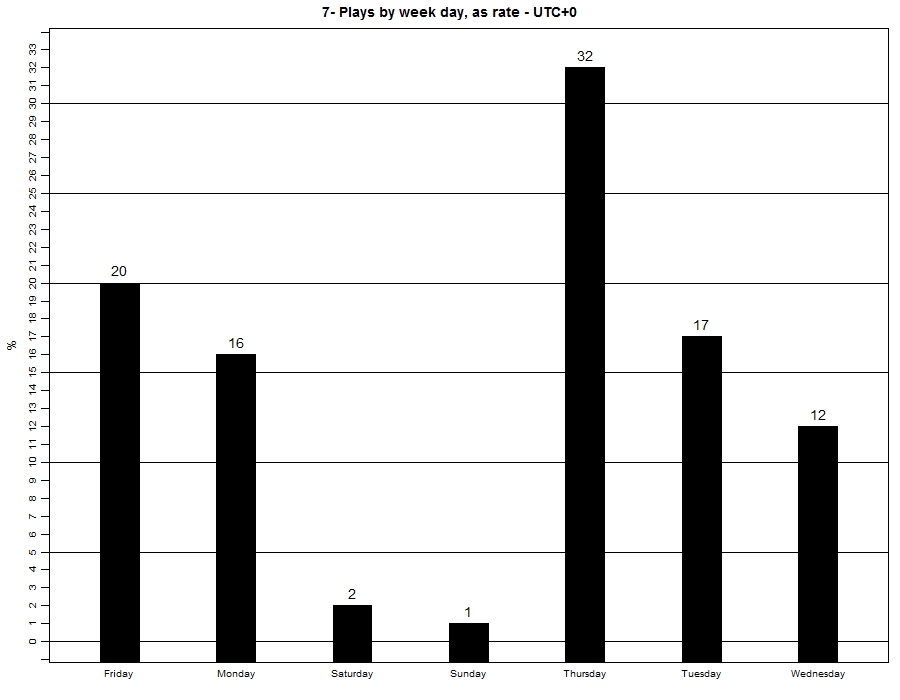
For some reason, React players are very Thursday addictive, 32% of all the games happens on this day. I don't know well why, and i don't really care about since it's a good number, what grinds me here is the number of games on the weekend. Why such a low rate? Should we make double points on weekends or something like this to attract weekend players? :-c
