You will visualize and make calculations from medical examination data using python. The rows in the dataset represent patients and the columns represent information like body measurements, results from various blood tests, and lifestyle choices. You will use the dataset to exploring the relationship between cardiac disease, body measurements, blood markers, and lifestyle choices.
Medical data visualizer CSV file link is generated in medical_visualizer.py
Medical_visualizer.py : Draw heat map and categorical plot to understand data Unit tests are written for you under testing.py
Development:
For development, you can use main.py to test your functions. Click the "run" button and main.py will run.
Testing:
We imported the tests from testing.py to main.py for your convenience. The tests will run automatically whenever you hit the "run" button.
Heat Map : 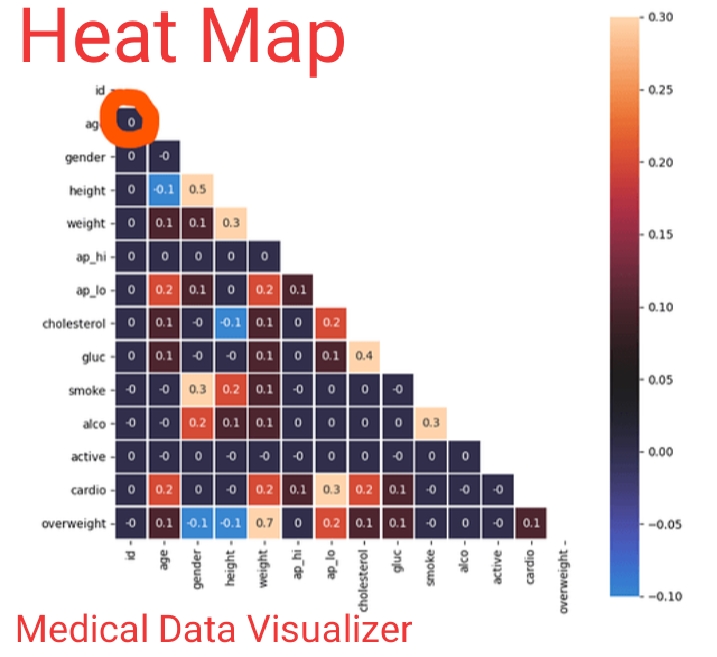
Categorical Plot : 