In statistics, the mean squared error (MSE) or mean squared deviation (MSD) of an estimator (of a procedure for estimating an unobserved quantity) measures the average of the squares of the errors—that is, the average squared difference between the estimated values and the actual value. MSE is a risk function, corresponding to the expected value of the squared error loss. The fact that MSE is almost always strictly positive (and not zero) is because of randomness or because the estimator does not account for information that could produce a more accurate estimate.
I used the Boston housing dataset for apply the mean square error with Python, this dataset contains information collected by the U.S Census Service concerning housing in the area of Boston Mass. However, these comparisons were primarily done outside of Delve and are thus somewhat suspect. The dataset is small in size with only 506 cases.
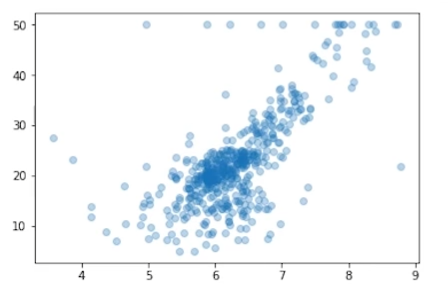
For this dataset we are going to use the mean number of rooms to predict the mean value of the house. Our value x will be the average number of rooms per dwelling and y will be the median value of owner-occupied homes in $1000's in our graph.
We plot the points without the regression.
Now using

We obtain the regression line estimated by the least squares
