![]()
![]()
![]()
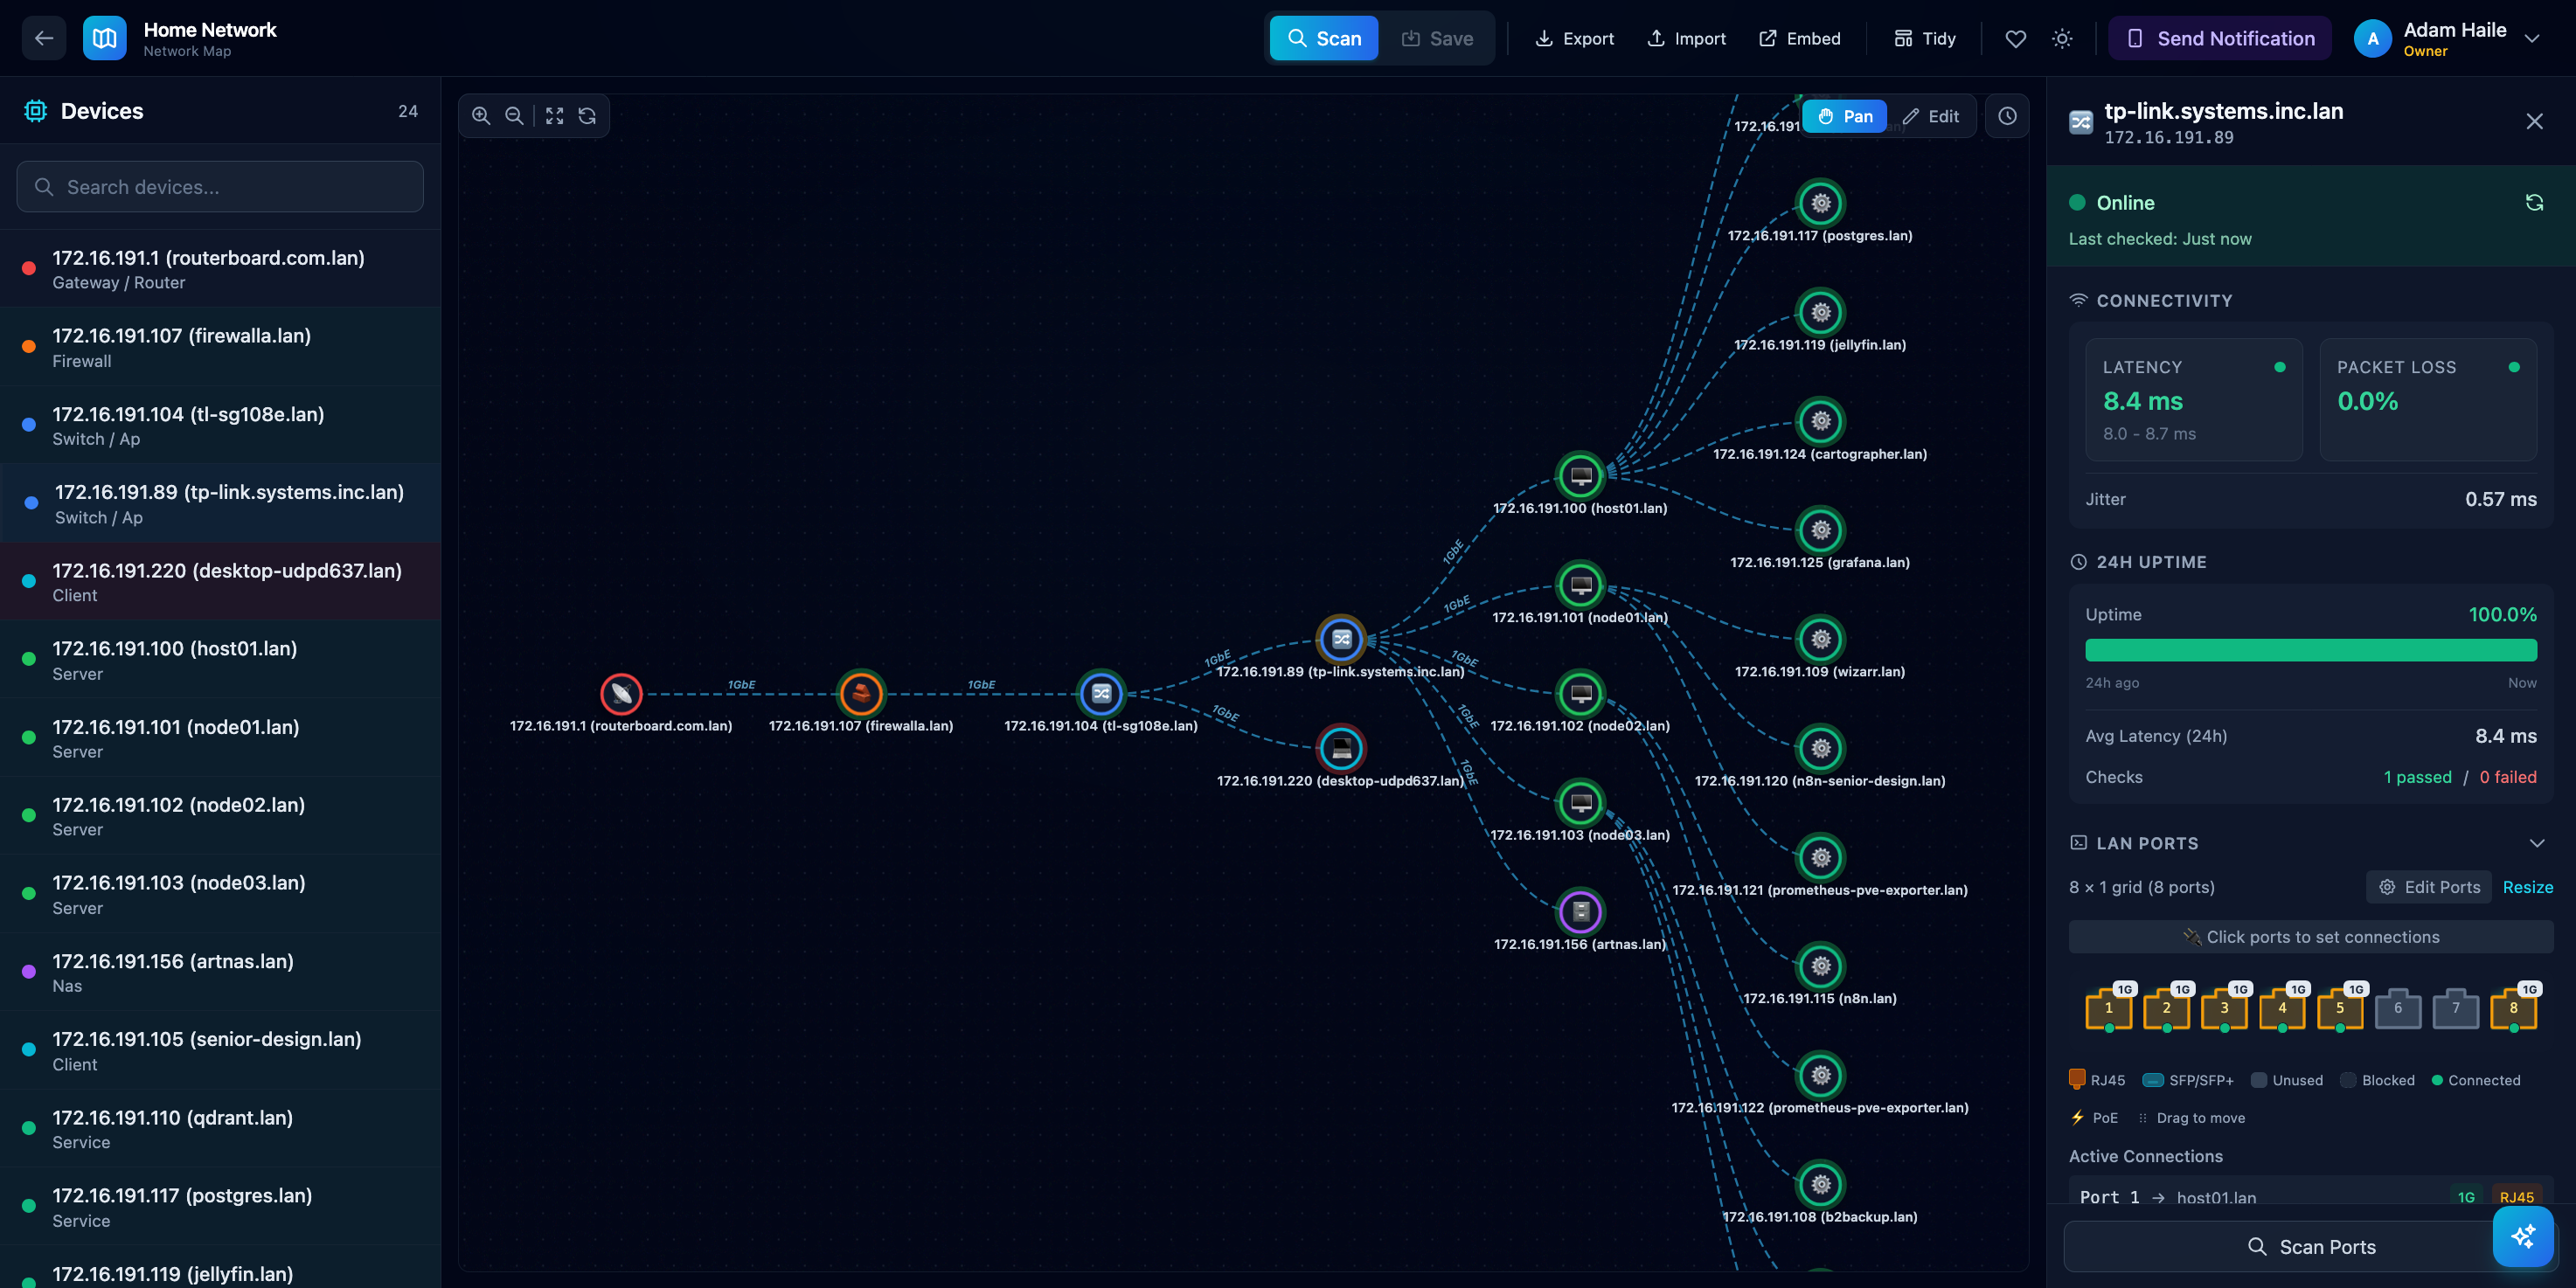
See every device on your network at a glance.
Cartographer is a self-hosted app that maps out your home or office network. It finds all the devices, shows how they're connected, and keeps an eye on their health — so you always know what's online and what's not.
flowchart TB
    subgraph Client["🖥️ Client"]
        Browser["Browser<br/><b>Vue.js 3</b> + <b>TypeScript</b><br/>Vite • Pinia • D3.js"]
    end

    subgraph Gateway["🚪 API Gateway"]
        Backend["Backend Service<br/><i>:8000</i><br/><b>FastAPI</b> + <b>Python</b><br/>SQLAlchemy • HTTPX • WebSocket"]
    end

    subgraph Services["⚙️ Microservices"]
        Health["Health Service<br/><i>:8001</i><br/><b>FastAPI</b><br/>ICMP • DNS • Speedtest"]
        Auth["Auth Service<br/><i>:8002</i><br/><b>FastAPI</b><br/>JWT • bcrypt • SQLAlchemy"]
        Metrics["Metrics Service<br/><i>:8003</i><br/><b>FastAPI</b><br/>Redis Pub/Sub"]
        Assistant["Assistant Service<br/><i>:8004</i><br/><b>FastAPI</b><br/>LangChain • Streaming"]
        Notification["Notification Service<br/><i>:8005</i><br/><b>FastAPI</b><br/>SQLAlchemy • Anomaly Detection"]
    end

    subgraph Storage["💾 Data Storage"]
        Postgres[("PostgreSQL<br/><i>:5432</i><br/><b>Primary Database</b><br/>users • networks • notifications")]
        Redis[("Redis<br/><i>:6379</i><br/><b>Pub/Sub & Cache</b>")]
    end

    subgraph External["🌐 External Services"]
        LAN["LAN Devices<br/><b>ARP</b> • <b>ICMP</b>"]
        AI["AI Providers<br/><b>OpenAI</b> • <b>Anthropic</b><br/><b>Google Gemini</b> • <b>Ollama</b>"]
        Email["<b>Resend</b><br/>Email API"]
        Discord["<b>Discord</b><br/>Bot API"]
    end

    %% Client connections
    Browser <-->|"HTTP/WS"| Backend

    %% Backend proxy routes
    Backend -->|"/api/health/*"| Health
    Backend -->|"/api/auth/*"| Auth
    Backend -->|"/api/metrics/*"| Metrics
    Backend -->|"/api/assistant/*"| Assistant
    Backend -->|"/api/notifications/*"| Notification

    %% Service to storage
    Backend --> Postgres
    Auth --> Postgres
    Notification --> Postgres

    %% Redis pub/sub
    Metrics -->|"Publish"| Redis
    Redis -->|"Subscribe"| Browser

    %% Service to service
    Metrics -->|"Fetch Health"| Health
    Metrics -->|"Fetch Layout"| Backend
    Assistant -->|"Get Context"| Metrics
    Health -->|"Report Events"| Notification
    Notification -->|"Get Baselines"| Health

    %% External connections
    Health -->|"ICMP Ping"| LAN
    Backend -->|"ARP Scan"| LAN
    Assistant --> AI
    Notification --> Email
    Notification --> Discord

    %% Styling
    classDef gateway fill:#4f46e5,stroke:#312e81,color:#fff
    classDef service fill:#0891b2,stroke:#164e63,color:#fff
    classDef storage fill:#059669,stroke:#064e3b,color:#fff
    classDef external fill:#d97706,stroke:#78350f,color:#fff
    classDef client fill:#7c3aed,stroke:#4c1d95,color:#fff

    class Backend gateway
    class Health,Auth,Metrics,Assistant,Notification service
    class Postgres,Redis storage
    class LAN,AI,Email,Discord external
    class Browser client
Service Ports:
| Service | Port | Purpose |
|---|---|---|
| Backend | 8000 | API Gateway + Static Files |
| Health | 8001 | Device health monitoring |
| Auth | 8002 | User authentication (JWT) |
| Metrics | 8003 | Real-time topology metrics |
| Assistant | 8004 | AI-powered network assistant |
| Notification | 8005 | Alerts via Email/Discord |
| PostgreSQL | 5432 | Primary database (users, networks, notifications) |
| Redis | 6379 | Pub/Sub event streaming |
- Discovers your network — Hit "Run Mapper" and watch as devices appear: routers, servers, NAS boxes, phones, smart home gadgets, you name it.
- Drag-and-drop editing — Rearrange the map to match how your network actually looks. Label things, group them, make it yours.
- Health at a glance — Green rings mean online. Red means trouble. No more guessing if your printer is down again.
- Smart alerts — Get notified when something goes wrong. Cartographer learns your network's normal patterns and alerts you to unusual behavior — like a device going offline unexpectedly or sudden latency spikes.
- AI assistant — Ask questions about your network in plain English. "What's down?" "Why is my connection slow?" Get instant answers.
- Live updates — See network changes in real-time as devices come online or go offline.
- Saves your work — Your layout is saved automatically, so you don't lose your changes.
- Multi-user — Set up accounts for family or teammates with different access levels.
If you're self-hosting, a Linux box or Docker is the smoothest path. Docker on Linux can use host networking, which gives the mapper and health checks the best LAN visibility.
Docker (recommended for all platforms)
Linux (best LAN visibility):
./deploy.sh up- Or
docker compose up --build -d
macOS and Windows (Docker Desktop):
docker compose -f docker-compose.windows.yml up --build -d
Note: Docker Desktop does not support host networking, so LAN discovery and ICMP health checks can be limited. For the most reliable results, run Cartographer on a Linux box or a Linux VM/host.
Then open http://localhost:8000 in your browser.
The first time you visit, you'll create an owner account. After that, click Run Mapper to scan your network and start building your map!
Native (no Docker)
Linux/macOS:
./dev.sh setup./dev.sh start
Windows (supported, but Docker Desktop is recommended for self-hosting):
.\dev.ps1 setup.\dev.ps1 start
The assistant can answer questions about your network using natural language:
- "What devices are unhealthy?"
- "Show me devices with high latency"
- "Which devices have been offline today?"
- "Summarize my network health"
To enable the assistant, you'll need to configure at least one AI provider. Copy .example.env to .env and add your API key:
cp .example.env .env
# Edit .env and add your API key (OpenAI, Anthropic, Google, or use Ollama for free local models)
If you run Ollama locally, no API key is needed — just make sure it's running!
Cartographer can alert you when things go wrong on your network:
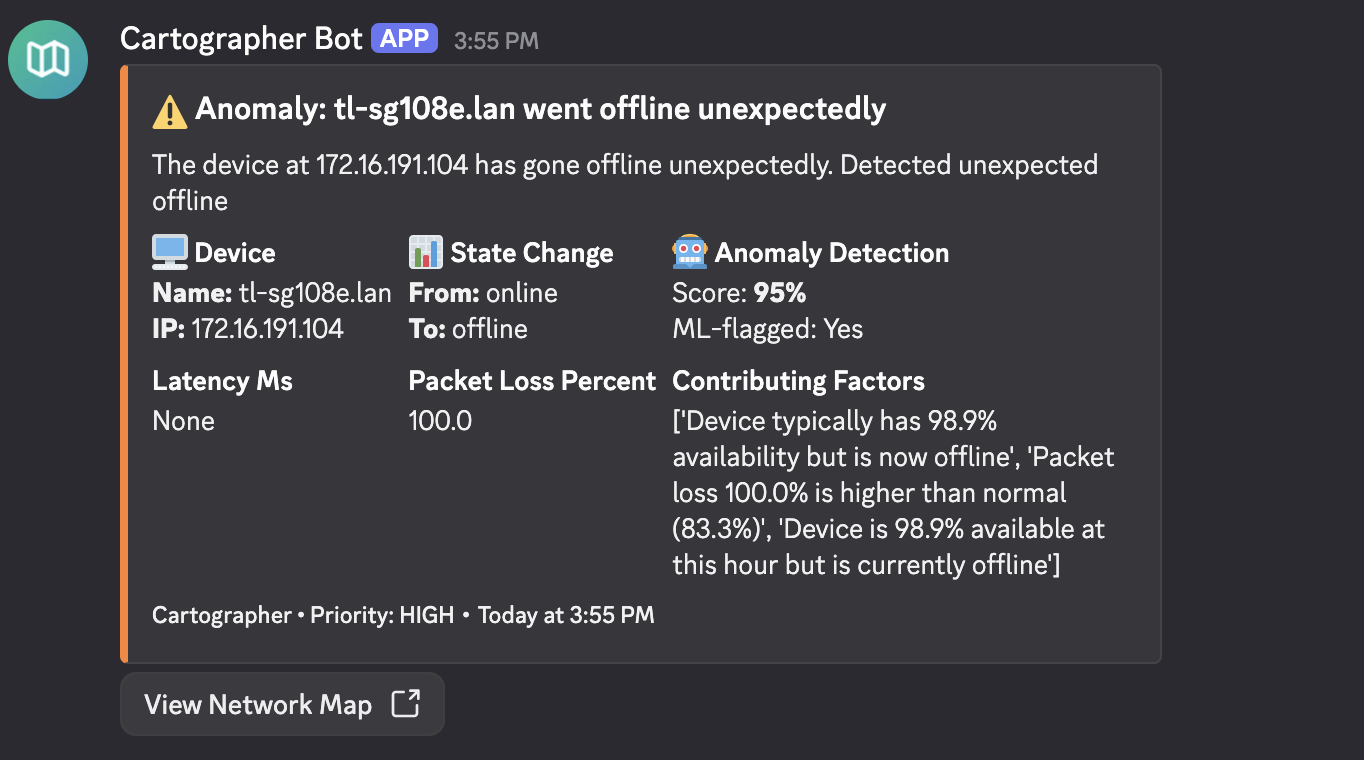
- Device down — Know immediately when a server, router, or important device stops responding.
- Device recovered — Get a heads-up when things come back online.
- Unusual behavior — Cartographer learns what's normal for your network and flags anything strange — like unexpected outages or performance issues.
You can receive alerts via:
- Email — Get clean, easy-to-read emails when something needs your attention.
- Discord — Send alerts to a Discord channel or get direct messages from the Cartographer bot.
To receive email alerts, sign up for a free Resend account and add your API key to .env:
RESEND_API_KEY=your_key_here-
Create a Discord app — Go to the Discord Developer Portal and click "New Application". Give it a name like "Cartographer".
-
Create a bot — In your app's settings, go to the "Bot" section and click "Add Bot". Copy the bot token.
-
Add your credentials to
.env:DISCORD_BOT_TOKEN=your_bot_token DISCORD_CLIENT_ID=your_client_id # Found in the "General Information" section -
Invite the bot to your server — Once Cartographer is running, go to the notification settings in the app. You'll find an invite link to add the bot to your Discord server.
-
Pick a channel — In the app's notification preferences, select which Discord server and channel should receive alerts (or enable DMs to get alerts privately).
In the app, you can configure:
- Which types of alerts you want (device offline, anomalies, etc.)
- Quiet hours so you're not woken up at 3am
- Rate limits to prevent notification spam
- Minimum priority threshold
All settings are optional and have sensible defaults. To customize, copy the example file:
cp .example.env .envThen edit .env with your settings. See .example.env for all available options and descriptions.
- Pan mode lets you scroll and zoom around the map.
- Edit mode lets you drag nodes, change their type, and rewire connections.
- Click any device to see more details and health info.
- Your changes auto-save, but you can also use Save Map to be sure.
- Open the Assistant panel and ask questions about your network in plain English.
- Set up Notifications to stay informed — the more Cartographer monitors your network, the smarter its alerts get.
Cartographer includes a comprehensive load testing suite built with Locust, a modern Python-based load testing framework. Use it to verify performance, find bottlenecks, and ensure stability under heavy usage.
Nightly Capacity Tests: Automated load tests run every night at 2 AM UTC to discover the system's maximum sustainable capacity. The "Nightly Capacity" badge above shows the number of concurrent users the system handled successfully in the most recent nightly run.
# Install dependencies
cd load-tests
pip install -r requirements.txt

# Run a quick test on all services
python run_load_tests.py -s all -u 10 -r 2 -t 60 --username YOUR_USERNAME --password YOUR_PASSWORD

# Or open the interactive web UI
python run_load_tests.py -s all --web --username YOUR_USERNAME --password YOUR_PASSWORD| Component | Technology | Purpose |
|---|---|---|
| Framework | Locust | Distributed load testing with Python |
| HTTP Client | HTTPX | Async HTTP requests |
| Test Data | Faker | Generate realistic test data |
| Service | Port | Description |
|---|---|---|
all |
8000 | All services via the backend proxy |
health |
8001 | Device monitoring, ping, DNS |
auth |
8002 | Authentication and user management |
metrics |
8003 | Network snapshots, Redis pub/sub |
assistant |
8004 | AI chat, providers, context |
notifications |
8005 | Alerts, Discord, anomaly detection |
# Baseline test (10 users, 60 seconds)
python run_load_tests.py -s all -u 10 -r 2 -t 60

# Sustained load test with HTML report
python run_load_tests.py -s all -u 50 -r 5 -t 600 --html report.html

# Spike test (high load, short duration)
python run_load_tests.py -s all -u 200 -r 50 -t 120

# Read-only operations (dashboard simulation)
python run_load_tests.py -s all -u 100 -r 10 -t 300 --tags read

# Stress test a single service
python run_load_tests.py -s metrics -u 100 -r 20 -t 300| Metric | Good | Acceptable | Poor |
|---|---|---|---|
| p50 Response | < 100ms | < 500ms | > 1s |
| p95 Response | < 500ms | < 2s | > 5s |
| Failure Rate | < 0.1% | < 1% | > 5% |
See load-tests/README.md for advanced usage, distributed testing, CI/CD integration, and test customization.
Cartographer maintains comprehensive test coverage across all services, validated by CI on every push and pull request.
Backend services (Python):
# Backend gateway
cd backend && pip install -r requirements.txt
pytest tests/ --cov=app --cov-report=term-missing

# Individual microservices
cd assistant-service && pytest tests/ --cov=app
cd auth-service && pytest tests/ --cov=app
cd health-service && pytest tests/ --cov=app
cd metrics-service && pytest tests/ --cov=app
cd notification-service && pytest tests/ --cov=app
Frontend (TypeScript/Vue):
cd frontend && npm ci
npm run test           # Run tests once
npm run test:coverage # Run with coverage reportCartographer enforces consistent code style using Black + Flake8 + isort for Python and ESLint + Prettier for TypeScript/Vue.
Run linters:
# All services
npm run lint              # Check all services
npm run format            # Auto-fix all services

# Backend only
npm run lint:backend      # Check all backend services
npm run format:backend    # Auto-fix all backend services

# Frontend only
npm run lint:frontend     # Check frontend
npm run format:frontend   # Auto-fix frontend

# Individual backend services
npm run lint:backend:main          # Backend gateway
npm run lint:backend:assistant     # Assistant service
npm run lint:backend:auth          # Auth service
npm run lint:backend:health        # Health service
npm run lint:backend:metrics       # Metrics service
npm run lint:backend:notifications # Notification service
Individual service commands:
# Python services (backend, assistant-service, auth-service, etc.)
cd backend
black app/ tests/           # Format code
isort app/ tests/           # Sort imports
flake8 app/ tests/          # Check style

# Frontend
cd frontend
npm run lint                # Check TypeScript/Vue
npm run lint:fix            # Auto-fix
npm run format              # Format with Prettier
npm run format:check # Check formatting| Service | Minimum Coverage |
|---|---|
| Backend | 90% |
| Frontend | — |
| Assistant Service | 95% |
| Auth Service | 95% |
| Health Service | 95% |
| Metrics Service | 95% |
| Notification Service | 80% |
All services run linting, tests, and coverage checks in parallel on every push/PR to main:
- Lint workflow - Code style enforcement
- Tests workflow - Test suite execution
Coverage reports are uploaded to Codecov.
This project uses Conventional Commits for semantic versioning. All commits must follow this format:
<type>(<scope>): <description>

[optional body]

[optional footer]
Commit types:
| Type | Description | Version Bump |
|---|---|---|
feat |
New feature | Minor (0.x.0) |
fix |
Bug fix | Patch (0.0.x) |
perf |
Performance improvement | Patch |
docs |
Documentation only | None |
style |
Code style (formatting, semicolons) | None |
refactor |
Code refactoring | None |
test |
Adding or updating tests | None |
chore |
Maintenance tasks | None |
ci |
CI/CD changes | None |
build |
Build system changes | None |
lint |
Linting fixes | None |
config |
Configuration changes | None |
Examples:
feat(auth): add OAuth2 support
fix(network): resolve connection timeout issue
docs: update README with deployment instructions
refactor(backend): simplify database queries
Breaking changes trigger a major version bump. Add ! after the type or include BREAKING CHANGE: in the footer:
feat!: redesign API endpoints# Install development dependencies (commit validation)
npm install
# The prepare script automatically sets up git hooksCommits on the main branch automatically trigger a release:
- Version is bumped based on commit type (
feat→ minor,fix→ patch) CHANGELOG.mdis updated- A git tag is created
After committing, push the release:
git push --follow-tags origin main
# Or use the helper script:
npm run push:release
Skip auto-release for a commit:
SKIP_AUTO_RELEASE=1 git commit -m "chore: quick fix"
# Or use the npm script:
npm run commit:no-release# Preview what the next release would look like
npm run release:dry-run
# Create a release (bumps version, updates changelog, creates tag)
npm run release
# Or specify the version bump type
npm run release:patch # 0.0.x
npm run release:minor # 0.x.0
npm run release:major # x.0.0- Make sure Docker is running and you're on the same network you want to map.
- The app needs elevated network permissions to scan devices — Docker Compose handles this automatically.
- Assistant not responding? Make sure at least one AI provider is configured in your
.envfile. - Not receiving notifications? Check that your email or Discord credentials are set up correctly in
.env, and make sure notifications are enabled in your preferences. - For advanced setup (production deployments, custom ports, etc.), check out
deploy.sh --help.
Built with FastAPI, Vue, and a lot of ping packets. 🗺️