As a personal project, I utilised my knowledge of spatial data analytics to look at factors that may contribute to childhood obesity. I did research on which states had the highest obesity rates ranked, in order, from highest to lowest. To carry out the analysis, I had to pick out which factors I could base my research on, from a list of well known contributing factors to obesity. The factors were:
- Food and Activity
- Environment
- Genetics
- Health conditions and medications
- Stress, emotional factors
Since my project revolves around spatial data analysis, it became clear from looking at the list, that I would perform my analysis on the first two factors: Food and Activity and Environment.
I take a look at and compare the cities of Denver, Colorado with Louisville, Kentucky for obesity rates in children ages 10-17. The reason for this choice is because Kentucky is ranked no.1 highest childhood obesity rate of 23.8% and Colorado has some of the lowest in the country at 11.2% ranked 46. I narrow down my two areas of study by only analysing the capital cities of each state i.e Denver and Louisville. This gives me good sample sizes of both states and allows for a good comparison because the population of both cities are similar in size.
Children between ages 10-17 spend the majority of their time in school which gives a good starting point for analysing the spatial factors. I can compare the locations of schools in relation to fast food places and parks to gather distance data and make comparisons for both cities.
OpenStreetMap (OSM) contains a vast amount of spatial data that is freely available for download. I downloaded and stored .shp file data of Colorado and Kentucky into QGIS. I added boundary lines for the counties located within each state. Using a postgreSQL database, I retrieved and stored the names, descriptions and location coordinates of schools, fast food places and parks from OSM.
I made sure to take a look through the data and perform any data cleaning/manipulation in order to make it usable for analysis later.
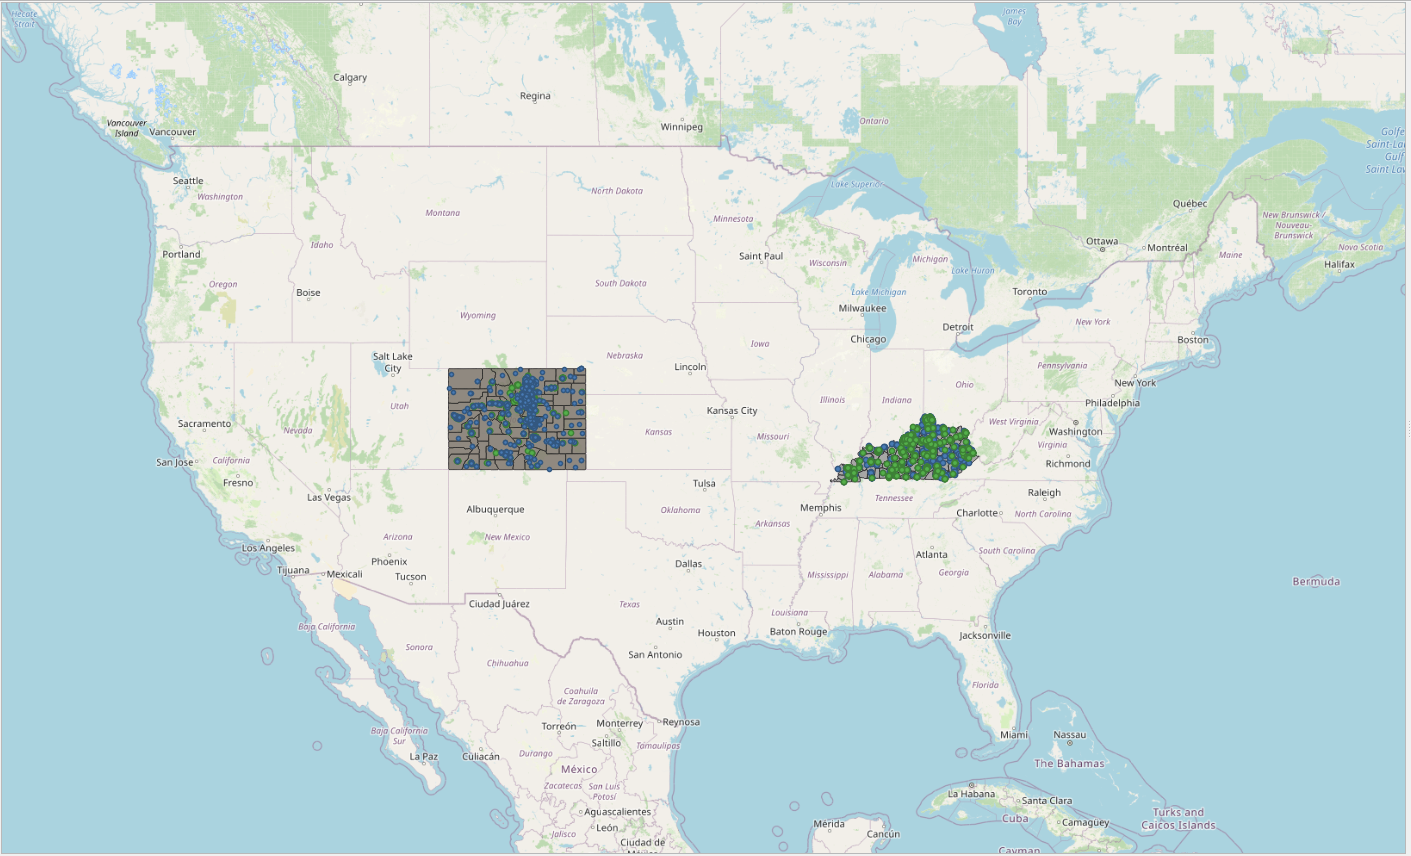
With my boundaries present, I could utilise SQL queries to remove everything outside the cities of Denver and Kentucky. This gave me a better picture of school, fast food and park locations on the map. I overlay these data points onto a map of the U.S.A above. Not only does this make for a good visual demonstration, it also allows me to confirm whether the geographic coordinates of points are correctly stored. i.e locations that should be located in the areas of interest are not scattered elsewhere. If points like that were to be found, I would have to either correct their location or delete the data point because it would not allow for accurate analysis.
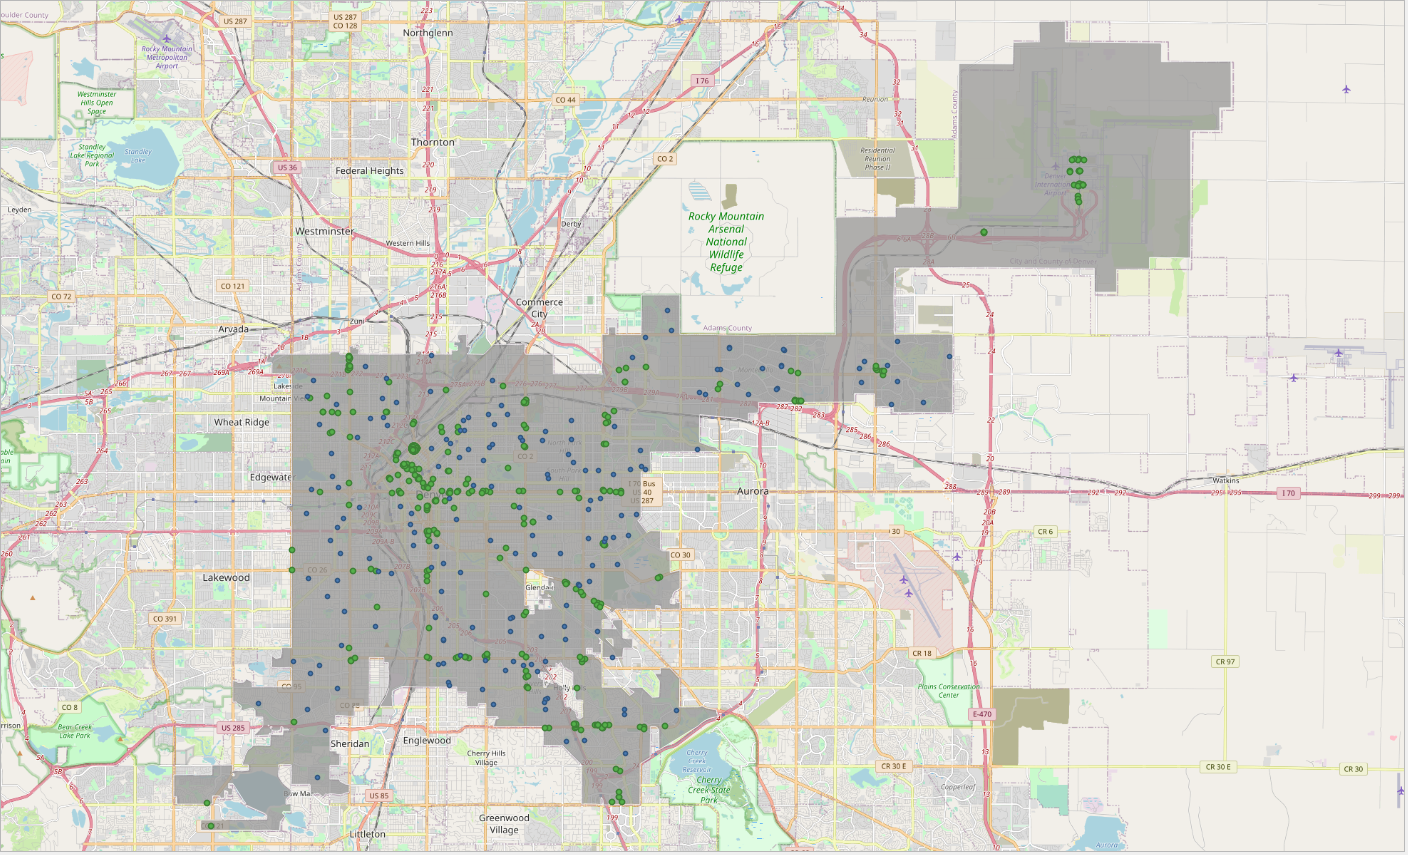
Below, you can see the city of Denver with boundary lines, school location (in blue) and fast food locations (in green).
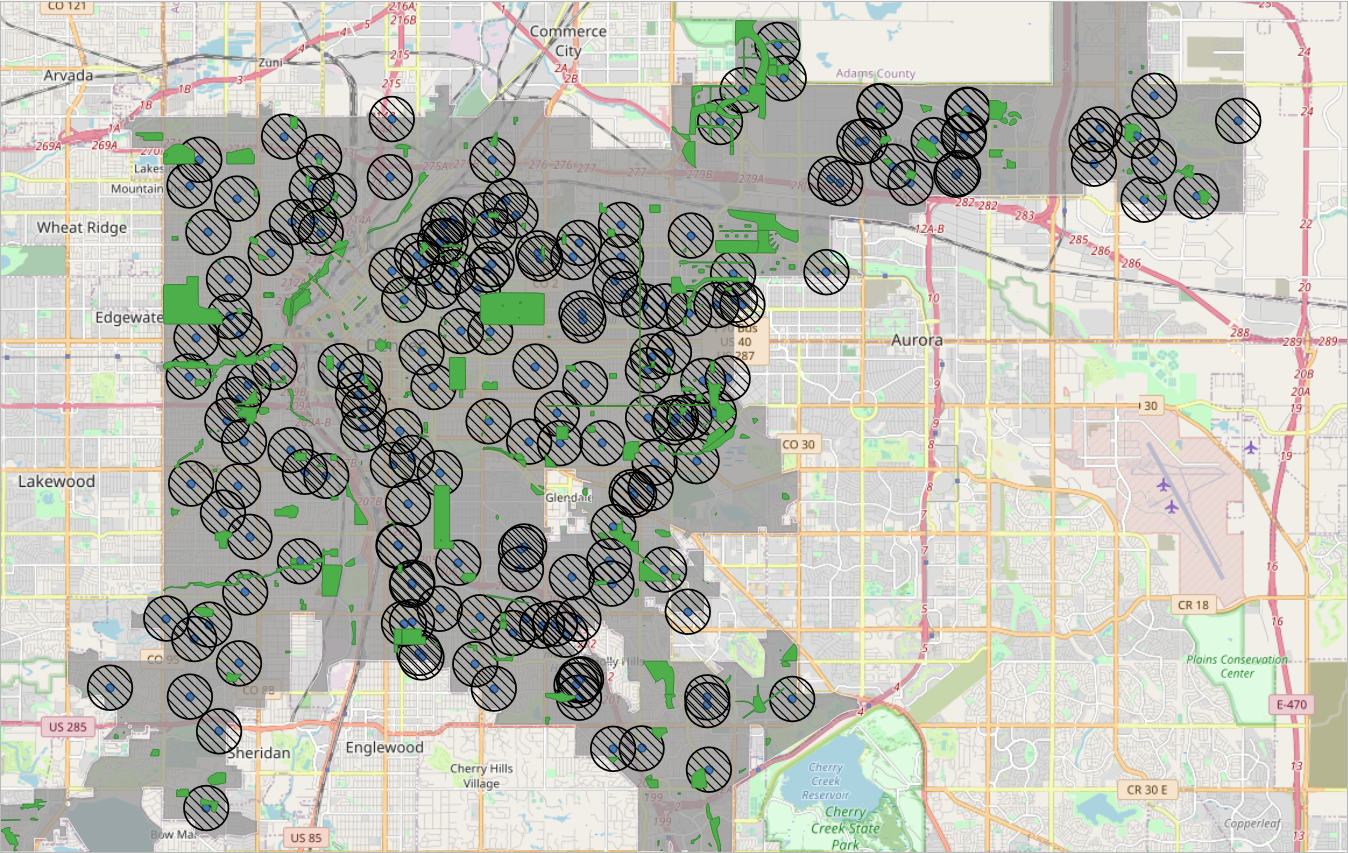
The buffer tecnique is used to create a circular boundary around each school point on the map. By choosing any radius, I can draw a circular buffer around each point. This allows me to use queries within SQL to check which, if any, fast food places or parks are located inside the school buffer zone. I do this for two buffer zones of 500m and 1000m. i.e How many fast food places or parks are located within 500/1000m of the school.
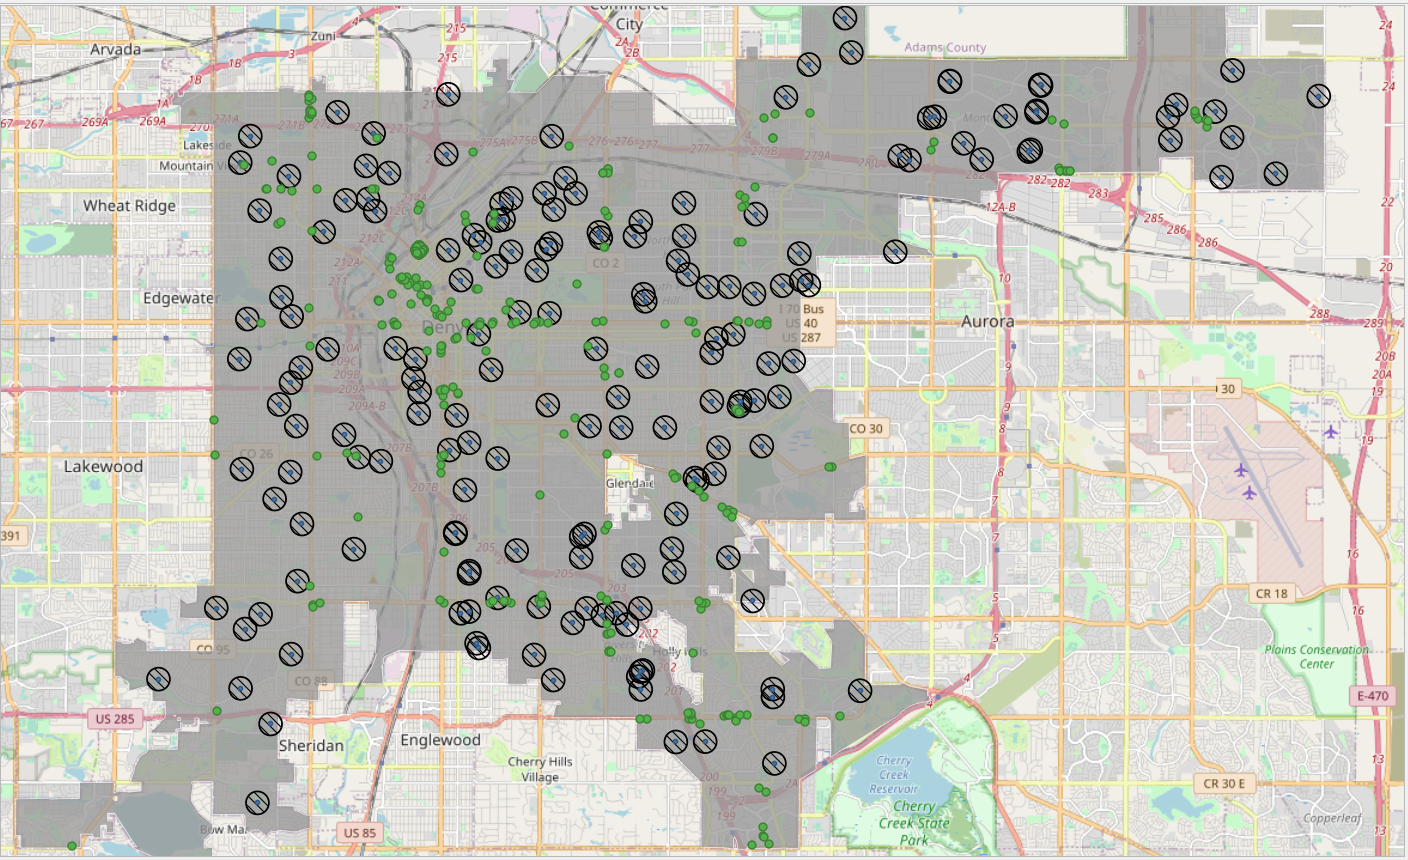
Above I show the 500m buffer around schools in Denver shaded. The locations of schools in green are visible and through SQL queries I can get a count of how many schools have a green point located within the buffer. The same analysis is carried out for 1000m buffers and parks.
This technique is ideal as it allows for mathematical analysis to be showcased visually on a map. I limit my analysis to get a count of how many schools have at least one fast food place that intersects with the buffer. This number is then be compared for both cities as a proportion to look for differences. Parks on the other hand are not singular points and are shown as geometric shapes. Thus, I can check whether the shape intersects with the circular buffer to get a count.
Although each query that I performed is noted in a separate file, I will provide a glimpse into how I retrieved the count through SQL.
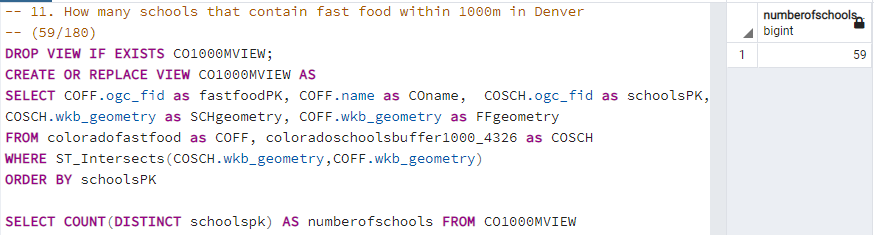
I utilised the ST_Intersects function within SQL to filter out which fast food places are located within my 1000m buffer zone and then displayed this using SELECT COUNT to display the number on the right.
It was found that:
- Denver has 180 schools and Louisville has 189 schools
- For the factor Food and Activity : 500m Buffer Analysis showed - Denver has 20 schools (11% of total) that have a fast food place within 500m and Louisville has 16 schools (8.5% of total) that have a fast food place within this distance.
- Carrying out the 1000m Buffer analysis - Denver has 59 schools (32% of total) that have a fast food place within 1km of the school while Louisville has 46 schools (24% of total) that have a fast food place within this distance.
- For the factor Environment : 1000m Buffer Analysis showed - Denver has 141 schools (78% of total) that have a park located within 1km and Louisville has 79 schools (41% of total) that have a park within this distance.
The fast food analysis shows that Denver has more fast food places near schools than Louisville. The obesity rates differ by a significant margin in both cities but this is not reflected in fast food to school location.
The park location analysis shows that 78% of schools in Denver have a park located within 1km. Compared to 41% of schools in Louisville close to a park. This shows almost a 2x difference in park location near schools.
To conclude:
- Fast food location itself does not look to be a factor in obesity rates among children.
- The location of parks where children can play and exercise can explain the difference in obesity rates.
A 7 minute presentation of this project is included within this repository that showcases the method and results in more detail.