Repository navigation

English guide · Русский · 简体中文
PriceGenerator creates reproducible synthetic candles for testing trading systems. Build a scenario, inspect it offline, then replay it or share the whole experiment with a colleague.
Generated volume is now a whole-number synthetic activity count. Fractional quantities in imported market data keep their original values.
Explore your candles
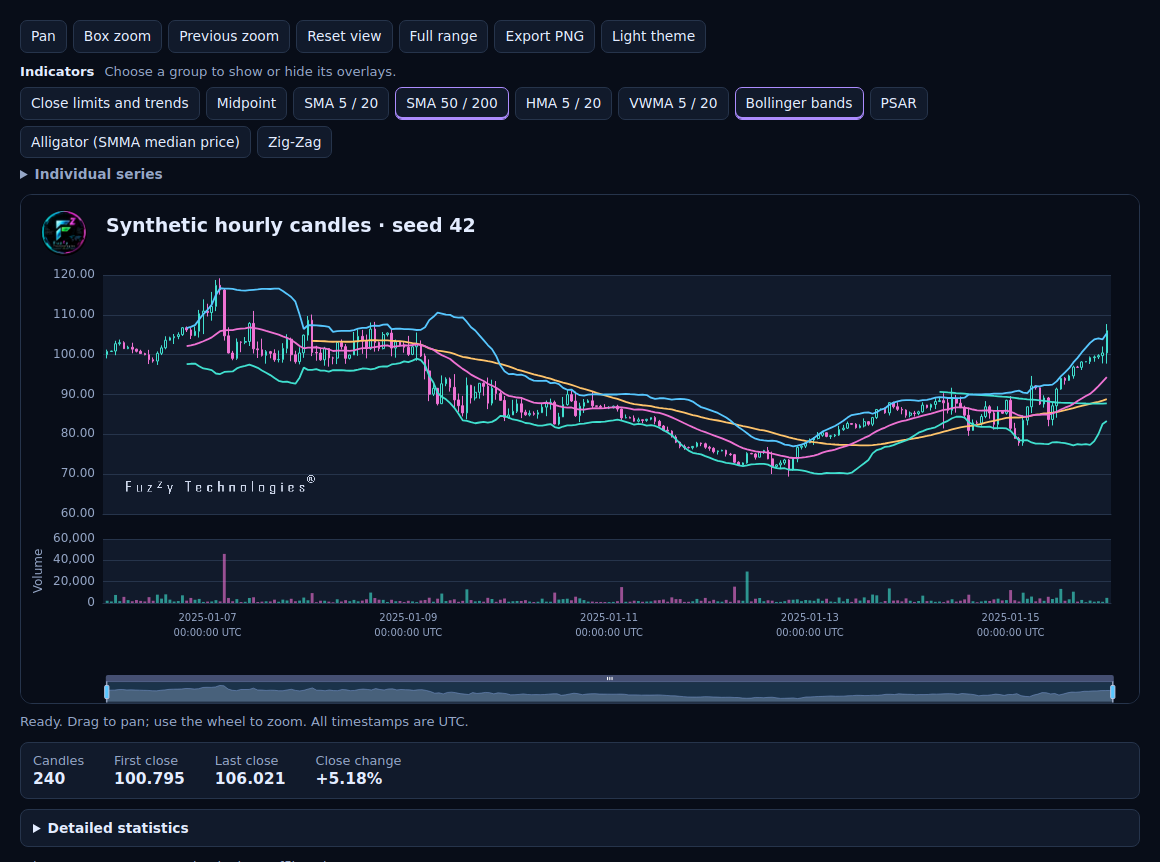
Start with a plain chart or add --analysis to reveal the indicator buttons. Try Bollinger bands to see the price envelope, SMA 50 / 200 to compare moving averages, and Midpoint to mark the middle of each candle. Individual series have their own switches. Dark is the default, and the light theme keeps your current zoom and selection. Export your current price and volume view as a PNG.
python -m pip install pricegenerator==2.2.0
pricegenerator generate --seed 42 --horizon 240 --start 2025-01-06T00:00:00Z --timeframe-seconds 3600 --output candles.csv
pricegenerator chart candles.csv --analysis --output candles.html --no-view
Open candles.html in a browser. The quick overview shows the first and last close and how much they changed. Expand Detailed statistics when you want the full report.
What else you can do
- Compare two series. Give PriceGenerator two OHLCV files with the same candle interval and compare volatility, drawdown, volume and other measures. Set tolerances for the metrics you care about.
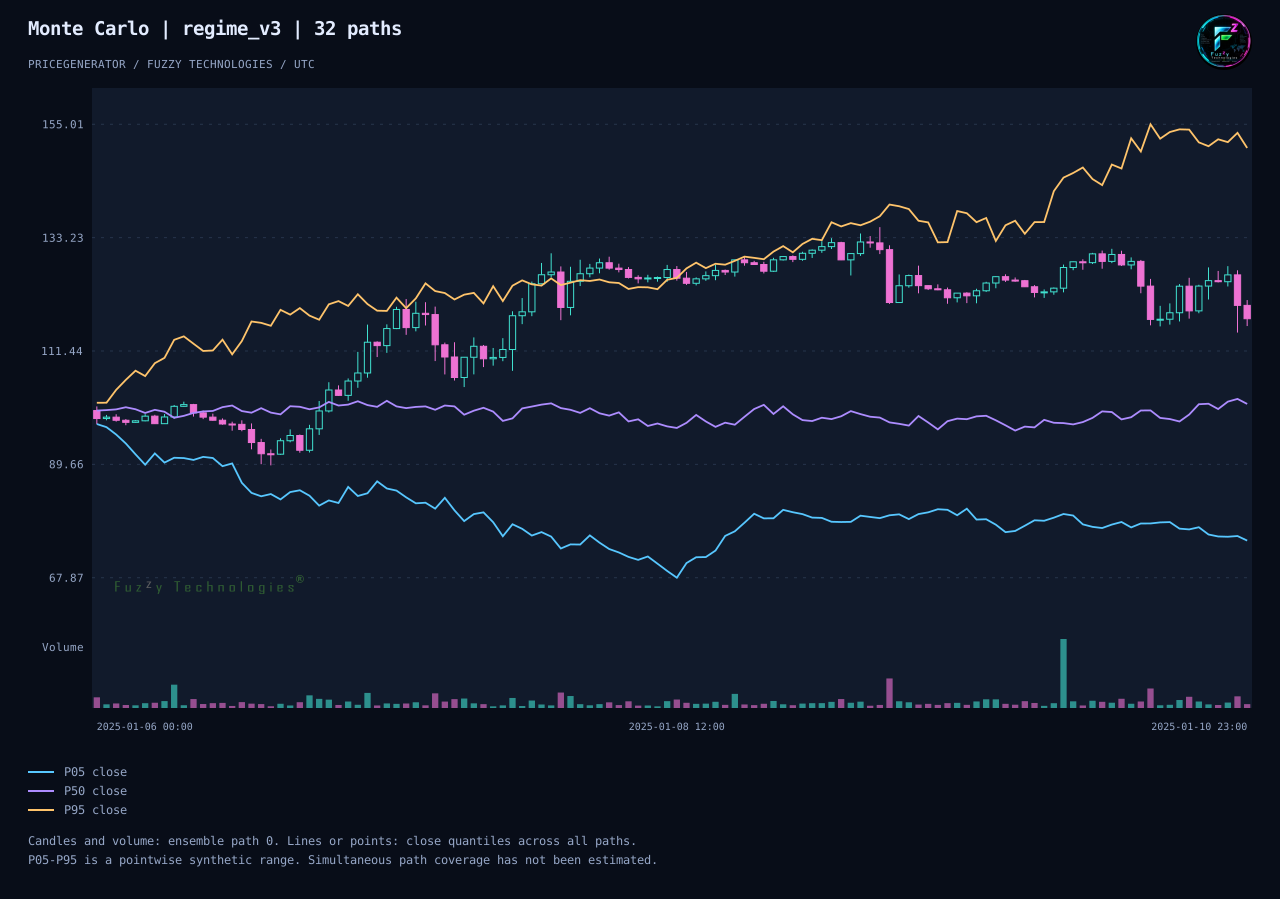
- Explore many outcomes. Generate a Monte Carlo ensemble from the same scenario. Candles show one run and the three lines summarize closing prices across all runs at each hour.
- Share a reproducible experiment. Save the settings, CSVs, manifests and charts together so someone else can replay the results.
- Run on CPython 3.10–3.15. The same core CLI runs across all six Python versions.