Repository navigation
Releases
PriceGenerator 2.2.0

English guide · Русский · 简体中文
PriceGenerator creates reproducible synthetic candles for testing trading systems. Build a scenario, inspect it offline, then replay it or share the whole experiment with a colleague.
Generated volume is now a whole-number synthetic activity count. Fractional quantities in imported market data keep their original values.
Explore your candles
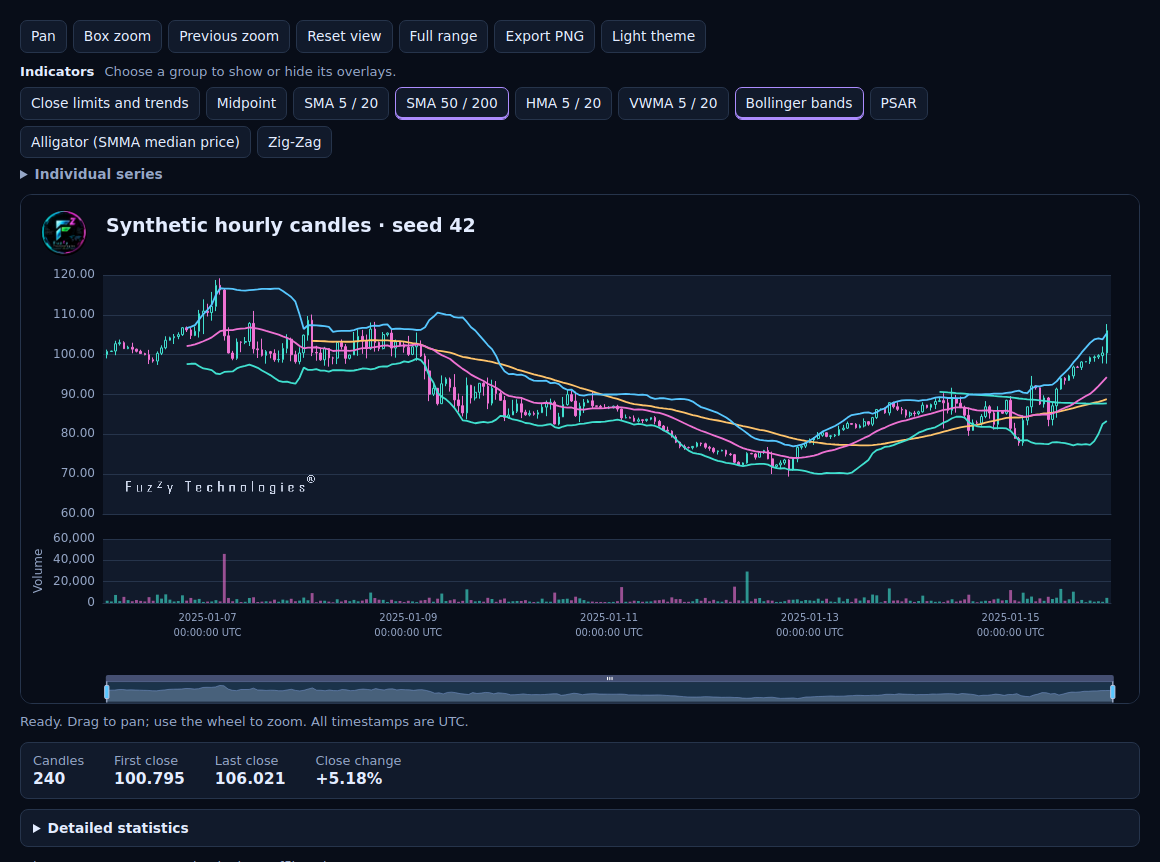
Start with a plain chart or add --analysis to reveal the indicator buttons. Try Bollinger bands to see the price envelope, SMA 50 / 200 to compare moving averages, and Midpoint to mark the middle of each candle. Individual series have their own switches. Dark is the default, and the light theme keeps your current zoom and selection. Export your current price and volume view as a PNG.
python -m pip install pricegenerator==2.2.0
pricegenerator generate --seed 42 --horizon 240 --start 2025-01-06T00:00:00Z --timeframe-seconds 3600 --output candles.csv
pricegenerator chart candles.csv --analysis --output candles.html --no-view
Open candles.html in a browser. The quick overview shows the first and last close and how much they changed. Expand Detailed statistics when you want the full report.
What else you can do
- Compare two series. Give PriceGenerator two OHLCV files with the same candle interval and compare volatility, drawdown, volume and other measures. Set tolerances for the metrics you care about.
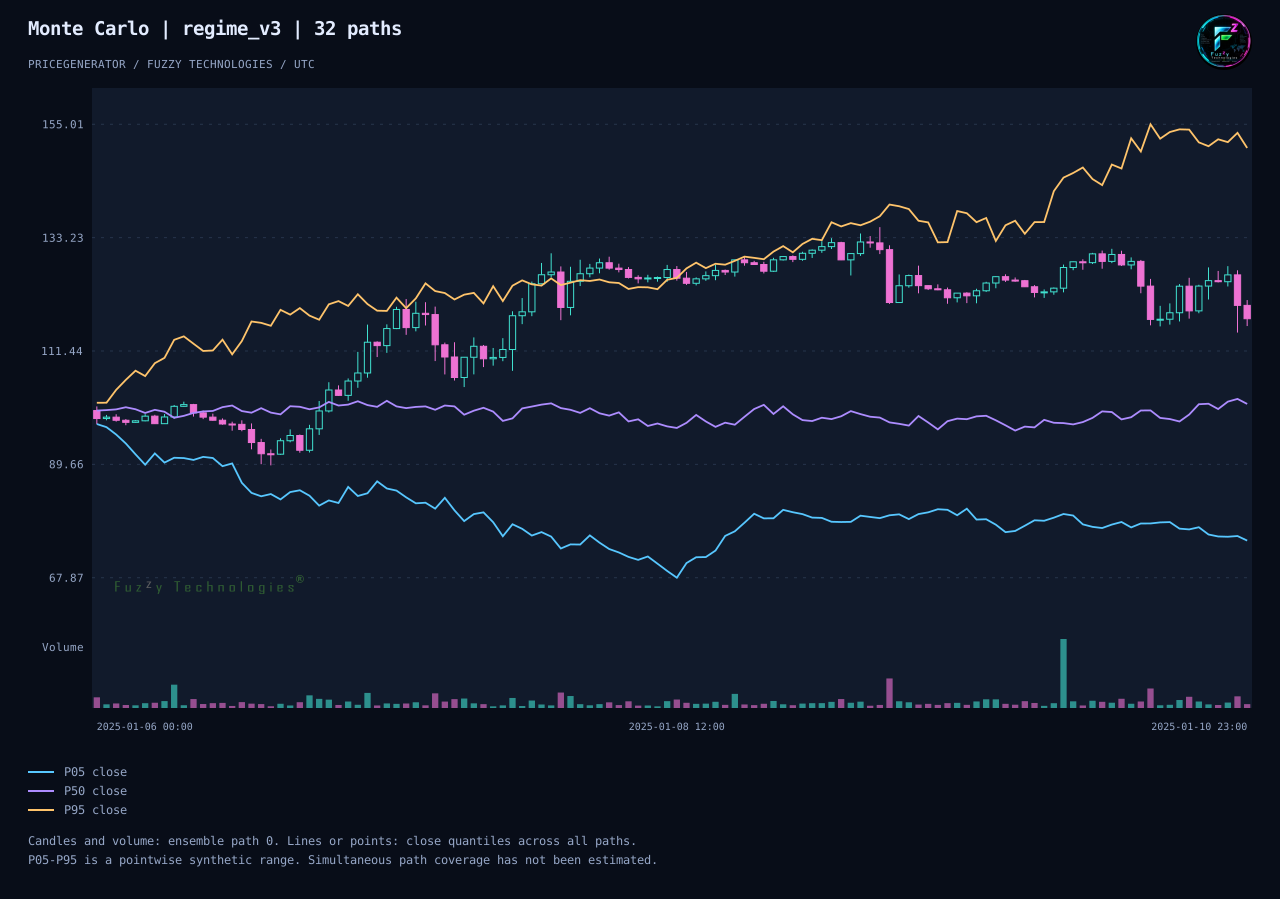
- Explore many outcomes. Generate a Monte Carlo ensemble from the same scenario. Candles show one run and the three lines summarize closing prices across all runs at each hour.
- Share a reproducible experiment. Save the settings, CSVs, manifests and charts together so someone else can replay the results.
- Run on CPython 3.10–3.15. The same core CLI runs across all six Python versions.
PriceGenerator 2.1.0 — Pre-release
GitHub pre-release for CPython 3.10–3.13.
- Reproducible Monte Carlo paths with worker-independent replay, drawdown summaries and quantile charts.
- Optional Mamdani regime diagnostics and rule traces with FuzzyRoutines.
- Faster canonical CSV writing and lower memory use during chart export.
- Localized examples, numerical model checks and a chronological BTC/USD holdout.
The ZIP contains the wheel, source distribution and SHA-256 checksums. PyPI publication is planned for 2.2.
PriceGenerator 2.0.0 — Test Release
This GitHub pre-release captures the tested v2 baseline. The latest PyPI release remains 1.4.93.
Compared with 1.4.93:
- New Python API and CLI for deterministic, seed-based OHLCV generation, scenario replay and strict UTC CSV interchange.
- Versioned generation models, statistical diagnostics, and experimental calibration, bootstrap and stress scenarios.
- Offline interactive ECharts charts, native SVG and optional PNG/JPEG export.
- Chunked generation for large series, modern packaging and CI verification of installed distributions.
The v2 API and CLI introduce breaking changes. The full release notes will accompany 2.1.0.
release-1.4.93
All release notes in english
All release notes in russian / Все релиз-ноты на русском
Issues included in the release
PriceGenerator API-doc
PyPI: 1.4.93 (2023-11-25)
Digest
Now the volume values depends on the previous value and outliers probability and looks more realistic. The generator algorithm creates a series of candles better for difficult trends, include differ outliers for upper and lower shadows of candles and its bodies. Also, bugs with negative numbers in series should no longer appear.
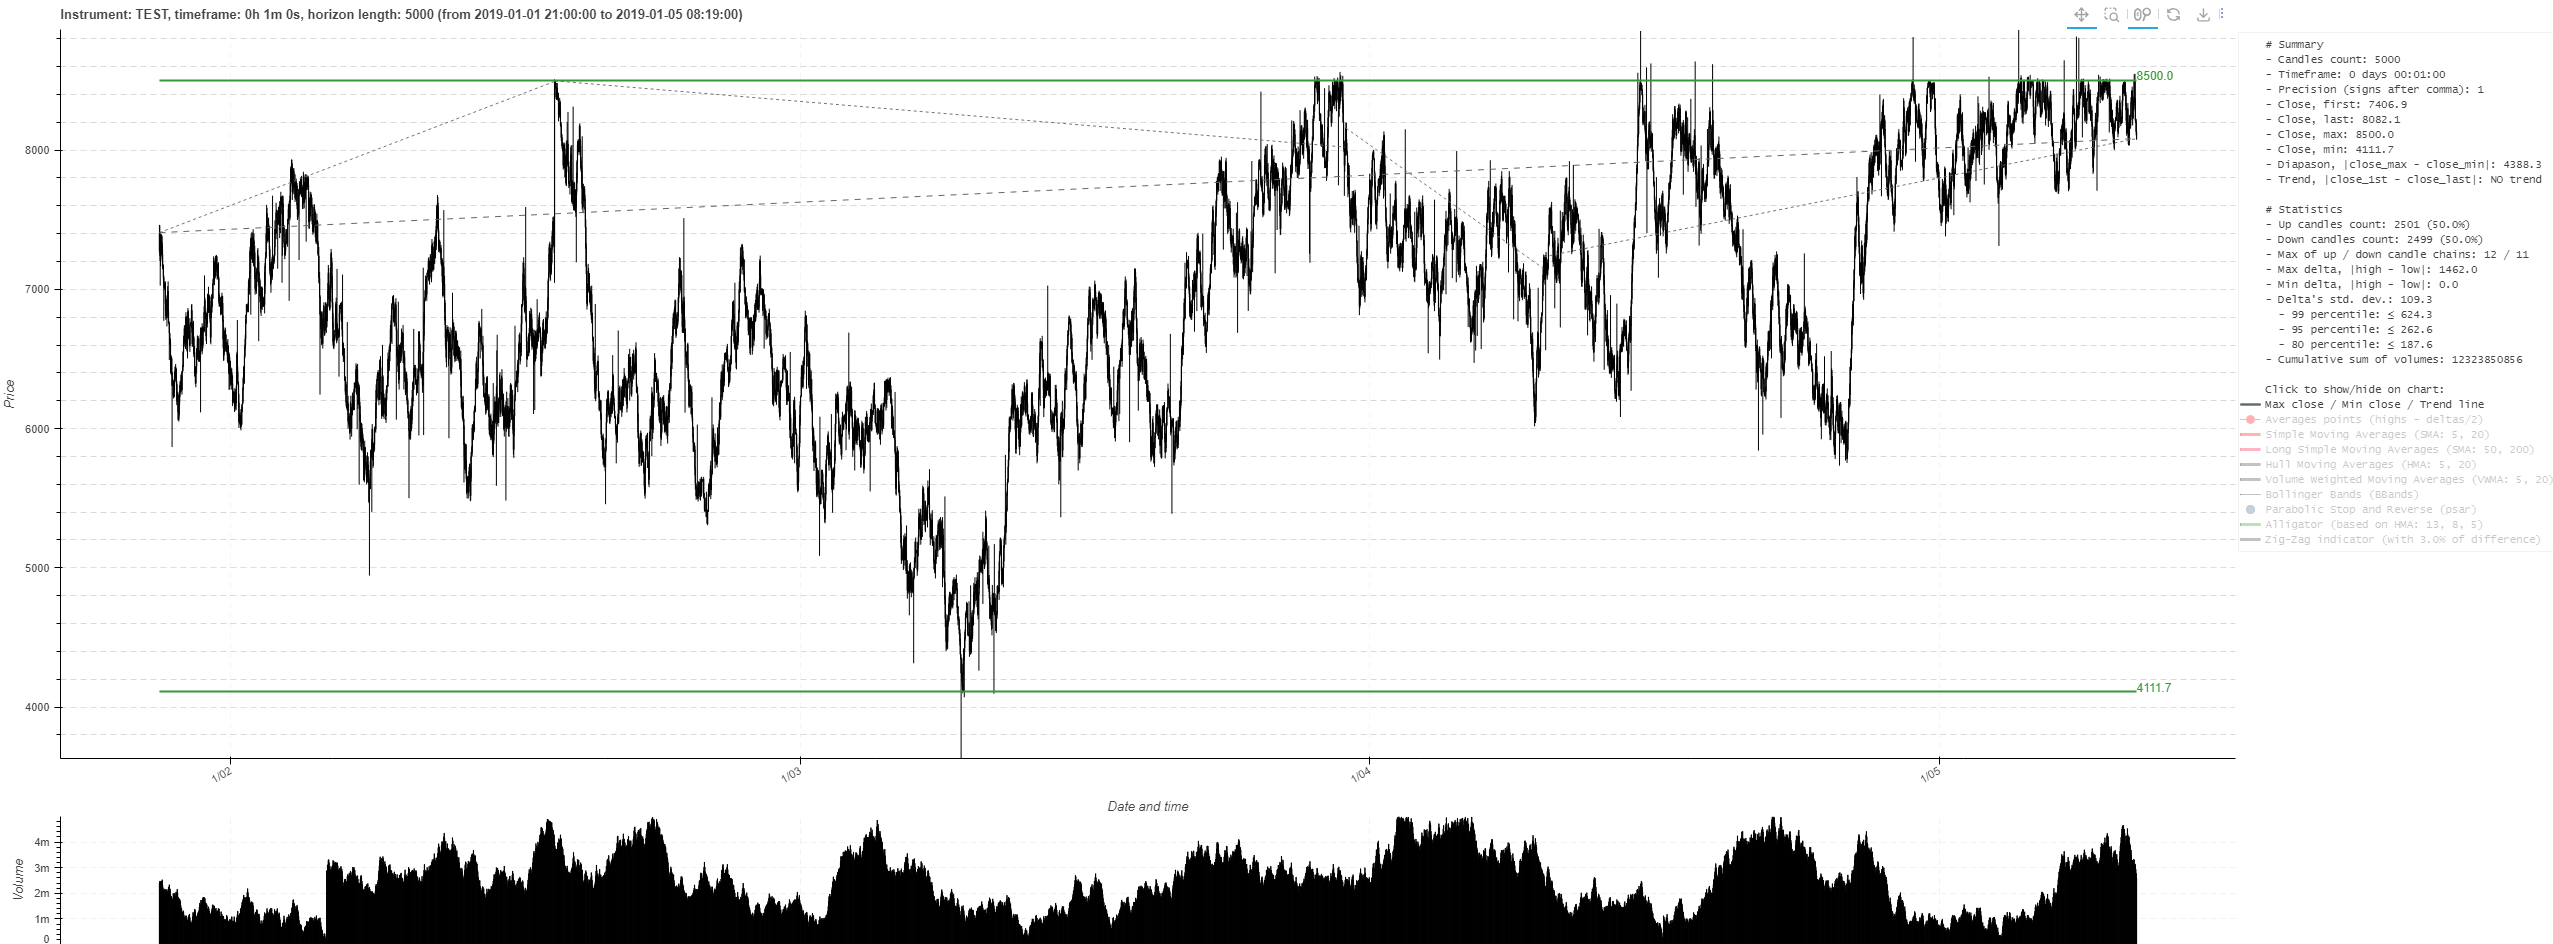
Example of the long-time series with realistic dispersion of volume values and differ trends:
New features
- The generator algorithm now creates a series of candles better for difficult trends, include differ outliers for upper and lower shadows of candles.
Improvements
- #22 Type of
ZigZagFilter()was changed to Pandas Dataframe instead of dict. - #25 Volume values now depend on the previous value and outliers probability.
Bug fixes
- #24 Bug fix with negative numbers in series.
release-1.3.81
Release notes in english
Release notes in russian
Issues included in the release
API-doc
PyPI: 1.3.81 (2023-01-05)
Digest
WARNING! Python supported version was changed to 3.9.
Now you can draw an additional custom lines and markers on main chart with candles (using RenderBokeh() method). You can specify trend directions with simple words: up, down, no or chars: u, d, n, when using --split-trend key (in addition to the existing ability to identify trend with symbols /\-), e.g. --split-trend=up-down-no-up, --split-trend=u-d-n-u etc. Also, you can choose themes for charts drawn by RenderBokeh() method with the new parameter darkTheme (if True then using dark theme, else light theme).
Light style example (with some custom markers and new average line):

Dark style example (with some custom markers):

New features
- WARNING! Python supported version was changed to 3.9.
- #17 Into the
RenderBokeh()method was addedlayoutsparameter. You can add new Bokeh Chart-objects on the Main Chart with that parameter. Also,darkThemeparameter was added. If itTrue, then will be used dark theme,False(by default) mean light theme. Also, you can manipulate with chart and adding lines or markers to the main chart. Usemarkersandlinesparameters for it.markersis a Pandas Dataframe with custom series, where additional markers will place on main series.Noneby default. One marker is a custom symbol, e.g. ×, ↓ or ↑ or anyone else. Marker data must contain at least two columns. There aredatetimewith date and time and some markers columns (markersUpper,markersCenterormarkersLower). Length of marker dataframes must be equal to the length of main candle series.linesis a list with custom series, where additional chart-lines will place on main series.Noneby default. Line data must contain at least two columns. There aredatetimewith date and time andcustom_line_namewith y-coordinates. Length of the chart-line dataframes must be equal to the length of main candle series. - #10 Ability to specify directions with words or chars was added. Words may be next:
up,down,noor chars:u,d,nfor the--split-trendkey, in addition to the existing ability to set up of the trend with symbols/\-. To separate words or chars use the hyphen symbol, e.g.--split-trend=up-down-no-up,--split-trend=u-d-n-uetc. - #13 API-doc on module
PriceGeneratorwas added.
Improvements
- #15 Statistic block view was improvement.
- #16 Examples were added: how to generate prices chain without candles.
Bug fixes
release-1.2.58
New feature: split data by some trends.
It was implemented two additional keys: --split-trend and --split-count. These keys affect the appearance of the trend and the number of candles in each trend.
The --split-trend key shows trends movements, e.g. --split-trend=/\- means that generated candles has up trend at first part, next down trend and then no trend.
The --split-count key set count of candles of difference periods, e.g. --split-count 5 10 15 means that generated candles has 3 trends with 5, 10 and 15 candles in chain.
To understand how it works, try one of these examples:
pricegenerator --horizon 300 --render-bokeh index.html --split-trend=/\- --split-count 50 100 150 --generate
pricegenerator --horizon 300 --render-bokeh index.html --split-trend=\/\ --split-count 50 100 150 --generate
pricegenerator --horizon 300 --render-bokeh index.html --split-trend=\-/ --split-count 50 100 150 --generate
pricegenerator --horizon 100 --render-bokeh index.html --split-trend=/\/\ --split-count 20 30 30 20 --generate
For the last example, you can get a picture like this:

release-1.2.46
- Some moving averages were added to Bokeh chart with pandas_ta library:
- Simple Moving Averages (5, 20, 50, 200),
- Hull Moving Averages (5, 20),
- Volume Weighted Moving Averages (5, 20),
Also, only "Max_close / Min_close / Trend line" is showing by default.
- Volatility indicators were implements:
- Bollinger Bands.
- Parabolic Stop and Reverse,
- Alligator (based on HMAs 13, 8, 5),
- ZigZag with 3% deviation by default.
-
Volume chart was added.
-
Candle's tooltips were added on main and volume charts.
-
The key
--horizonwhen loading from a file is used to specify loading of the last N=horizon candles. -
The
--precisionkey is used to specify the signs after comma. -
Bug fix with not detected timeframe when rendering from pandas dataframe without loading from file.
-
More tests and examples were added. Also, little refactor. All used libraries were updated.


release-1.1.30
Added new features:
- A lot of keys were added for CLI:
--ticker,--timeframe,--start,--horizon,--max-close,--min-close,--init-close,--max-outlier,--max-body,--max-volume,--up-candles-prob,--outliers-prob,--trend-deviation. That keys are overriding default parameters. - Implements new method
RenderGoogle()and a--render-googlekey that can be draw not interactive Google Candlestick chart. - Extended examples were added. See examples in README.md (english) and README_RU.md (russian).
release-1.0.19
The PriceGenerator library allows you to:
- save generated prices in .csv-format (example: ./media/test.csv);
- save the generated prices to a Pandas DataFrame variable for further use in automation scripts;
- automatically calculate some statistical and probabilistic characteristics of the generated prices and save them in markdown format (example: ./media/index.html.md);
- load the prices of real instruments according to the OHLCV-candlesticks model from the .csv file and carry out their statistical analysis;
- draw a chart of generated or loaded real prices and save it in html-format (example: ./media/index.html);
generated prices, a chart and some data on price behavior can be saved as a regular png-image (example: ./media/index.html.png).
- draw a chart of generated or loaded real prices and save it in html-format (example: ./media/index.html);
