This is a Google Data Analytics capstone project that answers the question:
- How do annual members and casual riders use Cycistic bikes differently?
- Why would casual riders buy Cyclistic annual memberships?
- How can Cyclistic use digital media to influence casual riders to become members?
Checkout my Tableau Visualisation here: Visuals
In this project i used Pandas, Matplotlib and Seaborn to analyze and answer business questions using 12 months of "bike-sharing" dataset. The data contains hundreds of thousands of data broken down into ride_id, rideable_type, started_at, ended_at, start_station_name, start_station_id, end_station_name, end_station_id, etc.
I followed the following steps to analyze the data:
- Importing the necessary libraries
- Reading and concatenating all 12 months CSV files into a single CSV file which i read into a dataframe
- Cleaning data by Changing the type of columns (to_numeric, to_datetime, astype)
- Dropping irrelevant columns
- Adding columns
Once i cleaned up the data a bit, i moved to the data exploration section. In this section i explored 5 high level business questions related to the data:
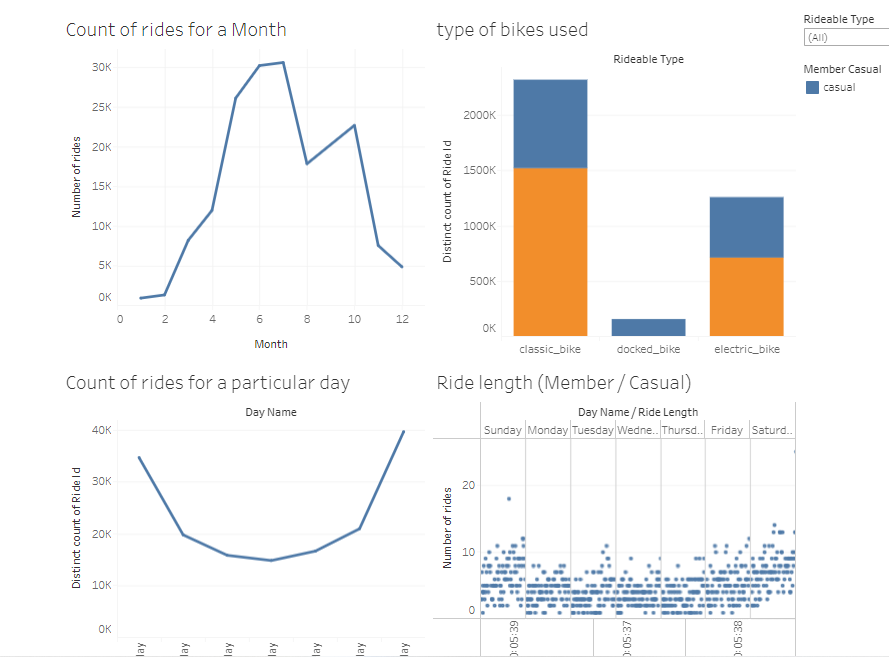
- How many rides were booked per day by Casual or Member riders?
- What was the count of member and casual riders?
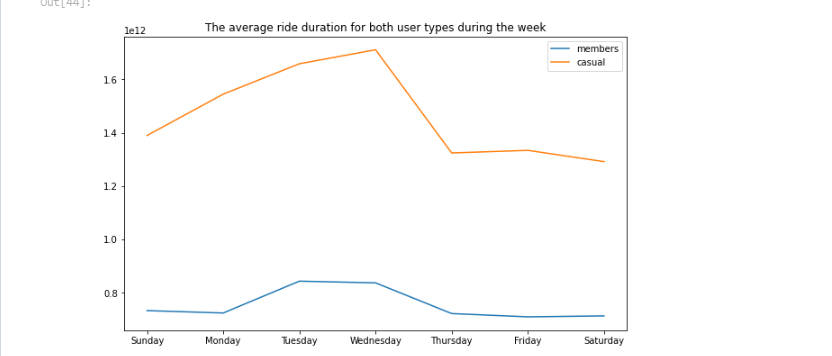
- What was the average ride duration for both user types during the week?
- How many rides were booked per month by Casual or Member riders?
- What is the total number of rides booked per month?
- What is the total number of rides booked per day?
- What type of bike was mostly used?
During the the analysis i came up with the following questions which gave insights on how Casual and Member riders use Cyclic Bike-sharing differently:
- Why do casual riders use more docked bikes than classic and electric bikes?
- Why do member riders use more classic and electric bikes than docked bikes?
- Why did casual riders book more rides during the weekend while member riders booked more rides on weekdays?
- Why the average ride duration of casual riders is greater than members during the week? ##PREVIEW:
For answers refer to my jupter notebook. And checkout my Tableau Visualisation here: Visuals
Casual riders use more docked bikes than classic and electric bikes as docked bikes are easily accessible. You can get bikes at any docking station unlike Casual and Electric bikes.
Member riders use more Classic and Electric bikes because the classic bikes are cost effficient as they are mostly undocked so you can just park it anywhere and not bother about docking it at a docking station before the time runs out. They also use electric bikes because they are fast and help them commute to work faster with less energy spent cycling.
Member riders bookes more rides during weekend as they want to enjoy the leisure of the weekend and spend more time outside.
Average ride duration of causal riders is more than member riders as member riders tend to go for work and return home from work.