 The final Tableau interactive dashboard is viewable here.
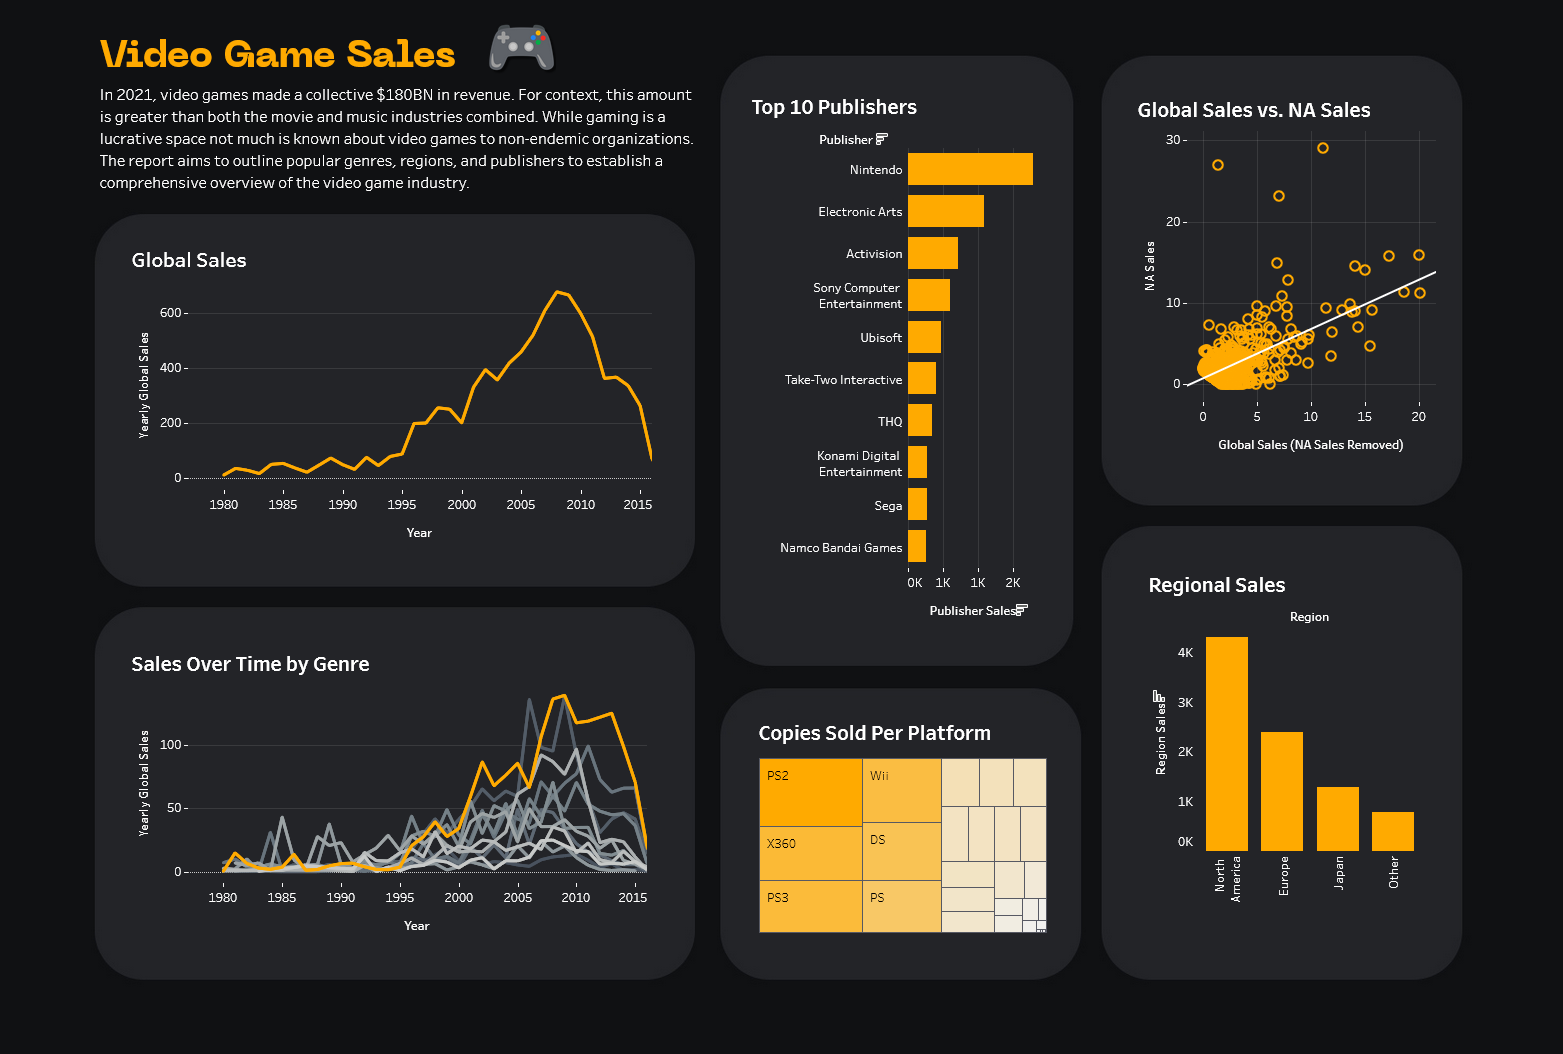
In 2021, video games made a collective $180BN in sales revenue. For context, this amount is greater than both the movie and music industries - combined. While gaming is a lucrative space, not much is known about video games to non-endemic organizations. This report aims to outline popular genres, regions, and publishers to establish a comprehensive overview of the industry.
The list of queiries that were used to create the supporting dashboard for this project can be found in the VizScripts.sql file. The full list of scripts can be found in the Sandbox.sql script file.
Due to the nature of this project, there is no prompt or stakeholder requesting specific metrics from this dataset. Because of this, I created a short prompt to ensure that the overall dashboard was concise and answered interesting questions. Here is the prompt:
💡 A digital marketing agency has allocated part of their budget this year to better understand how to reach consumers through the use of video games. As this is their first venture into this industry, they require an overview of relevant organizations, regions, and interests within the community. Create an insightful dashboard that may provide this agency with some actionable feedback.Based on this prompt some questions were generated and I had a hypothesis based on whatever domain knowledge I had collected over the years of being a consumer.
- Do video game sales historically trend up or down?
- Which genre of video game is the most popular?
- Which publishers sell the most video games?
- Which platform holds the most copies?
- Is there any correlation between sales in North America and Global Sales?
- Would assume they trend up given their greater combined popularity in comparison to other entertainment industries.
- Given anecdotal experience with video games, Action, Sports, and Role-Playing games will be the most popular games.
- Some publishers own gaming platforms/consoles, would assume they would have the majority of the market share - Xbox, Playstation/Sony, and Nintendo.
- I assume it would be correlated to the console that simply sold the most units - which external sources state is the PlayStation 2.
- Since many video game developers and publishers primarily target North American audiences, a high correlation is assumed. However, it would also be interesting to see which games deviate from this correlation.
My goal during data analysis was to create graphs that answer at least one of the questions above and or is able to provide some insight into the market.
🔗 The final dashboard with all these interactive charts can be found here.
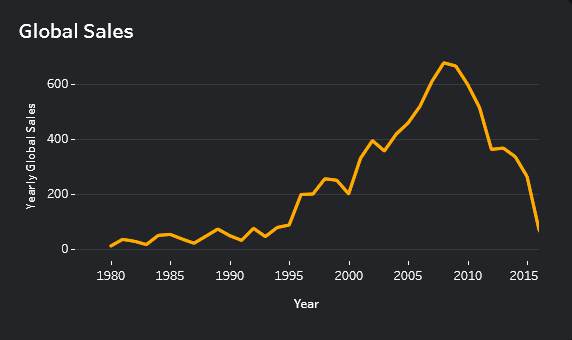
This first graph already prompted some intrigue about this dataset’s validation as the number of sales drops sharply after 2011, which does not align with my personal expectations. Therefore, I decided to do some investigation into the dataset. My first action was to check the number of observations for each year - if the years after 2011 had fewer observations then it would warrant further analysis. I constructed a query which resulted in the following:
| Year | Number of Games |
|---|---|
| 2010 | 1259 |
| 2011 | 1139 |
| 2012 | 657 |
| 2013 | 546 |
| 2014 | 582 |
| 2015 | 614 |
| 2016 | 344 |
Based on this, there were fewer games recorded after 2011. Due to this, I reexamined the conditions of data collection. The data collector noted that their collection only included games that exceeded sales greater than 100,000 copies.
- Fewer games crossed the threshold of 100,000 sales after 2011
- Video games typically trend upwards but faced a slump between 2011-2016
- The popularity of video games was extremely high between 1995 - 2010
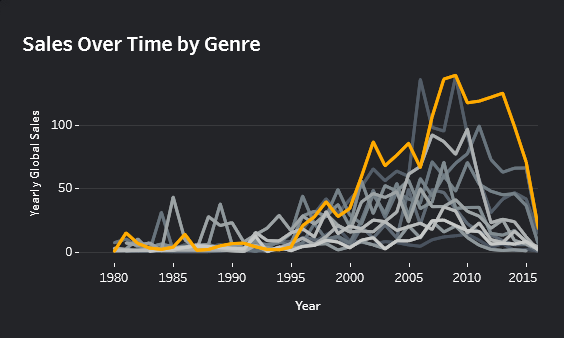
Following the observation of a sales decline, I wanted to know if there were any genres that were particularity resistant to this industry wide slump. Therefore, I constructed the same graph, except this time broke up the lines by genre. The yellow line represents Action games.
- Action games resisted the industry slump of 2011 until 2013
- Action games were not initially popular, but quickly became the most popular post 2000
- All genres generally trend together indicating the market trend is the most significant
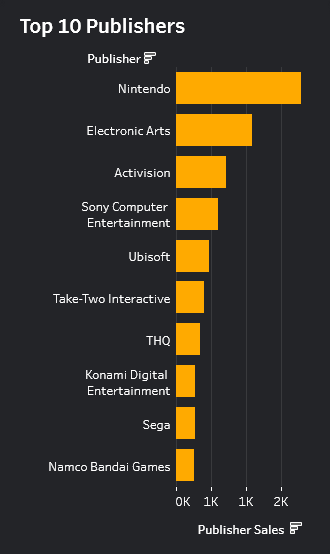
Continuing with the analysis, I was interested in answering the third question - which publishers were the most popular. I had assumed that the publishers who own consoles would sell the most games. This was true as two console manufactures - Nintendo & Sony were both in the Top 5 publishers ranked by Sales.
- Console manufacturers (Nintendo & Sony) out performed a significant number of publishers
- Nintendo had 1.5 times more sales than the 2nd place publisher - Electronic Arts (EA)
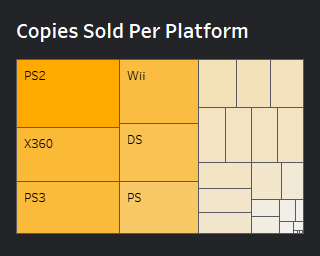
Now that the industry has been viewed from the publisher perspective, it would also seem advantageous to understand which platforms are the most popular. This graph also serves to answer the fourth question - which platform sold the most copies?
- PlayStation 2(PS2) sold the most console units, which correlates with selling the most games
- PlayStation’s manufacturer Sony produced half of the top six platforms
- Nintendo produced two of the top six platforms - DS & Wii
- The Xbox 360’s manufacturer Microsoft produced only one of the top six platforms
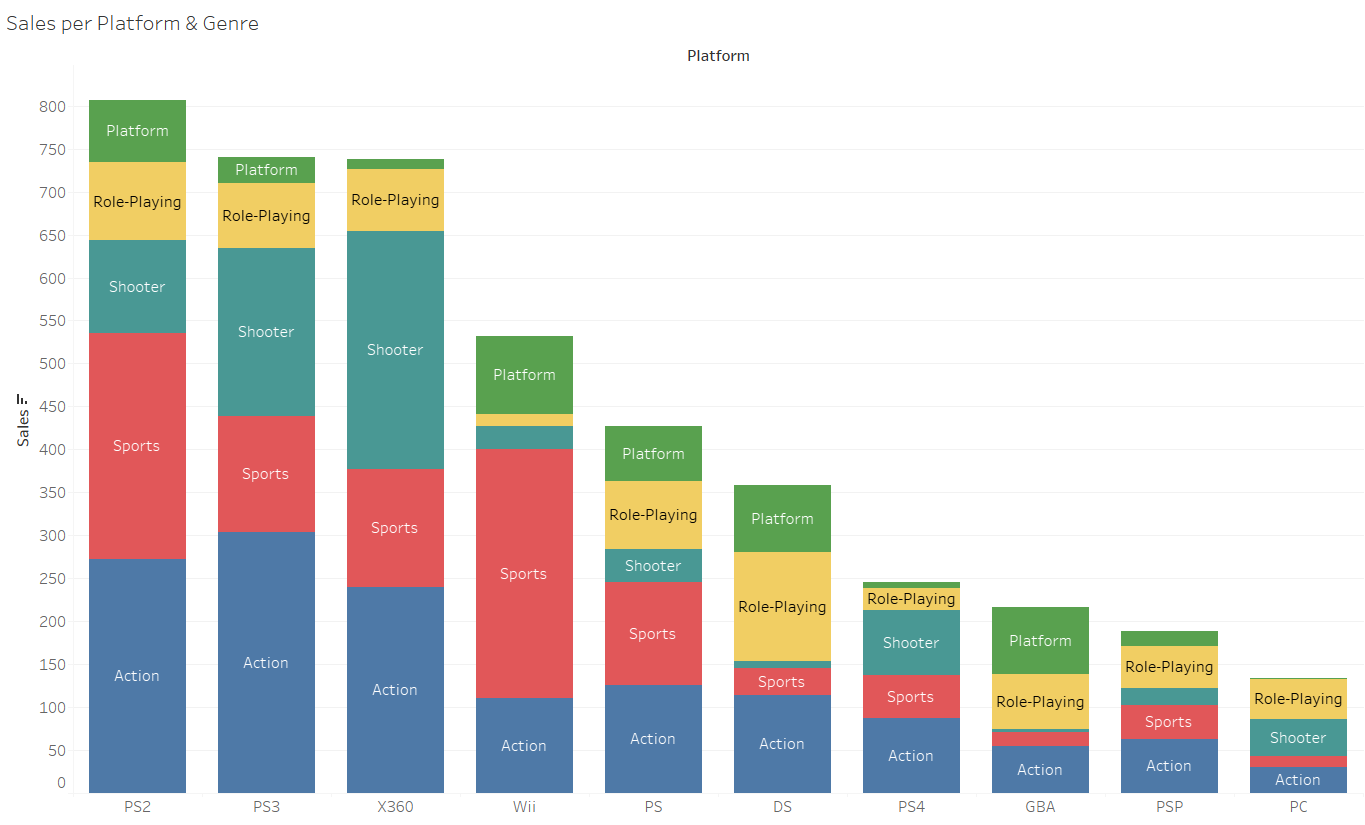
The next trend to investigate was to see if any of these platforms had an affinity for a specific genre of game. This was accomplished by further breaking down each platform’s sales by genre to observe any meaningful differences.
- Action and Sports games are popular across all platforms
- Nintendo Wii player base has an affinity for casual sports games
- Xbox 360 player base has an affinity for shooter games
- Handheld consoles (DS, GBA, PSP) have higher sales for Role-Playing games
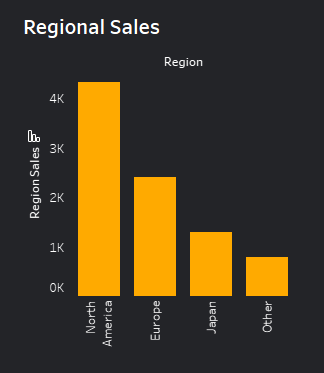
Now that we’ve observed some trends across publishers and genres, I thought it important to also examine regional trends, as targeting specific regions is important to marketers. To accomplish this, I started with finding out which region had the most sales.
- North America has the most sales - double that of Europe which ranks 2nd
- The top 3 regions were North America, Europe, and Japan
- Marketers may only wish to target audience within these three regions
- Interestingly, many of the top publishers have offices based out of or in these specific regions
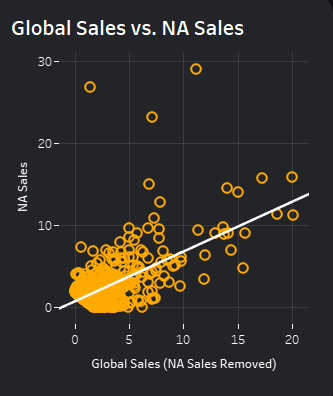
Since North America is the primary market for most video game developers, I wanted to see how strong the correlation was between a game performing well in North America and the game performing well in the rest of the world.
- R-squared value of 0.396 would indicate a moderate positive correlation between a game performing well in North America and also performing well globally
- Tetris, Duck Hunt, and Super Mario Bros were three games that performed very well in North America but not as well globally
- Wii Sports was an outlier, performing well both in NA and globally with 41 million in sales for each category.