.png)
.png)
.png)
.png)
.png)
.png)
.png)
.png)
The objective of this assignment was to create a Python script to visualize weather of over 500 cities globally, based on their distance from the equator.
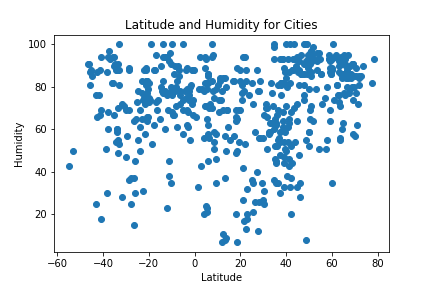
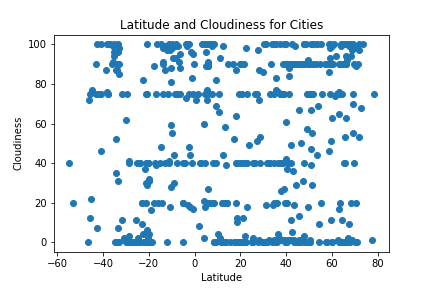
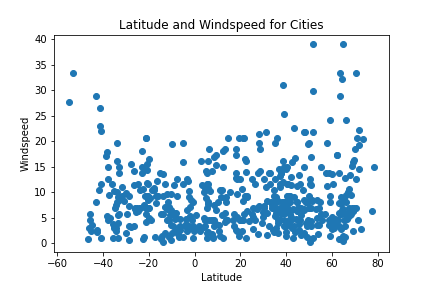
I created a series of scatter plots to show the following relationships:
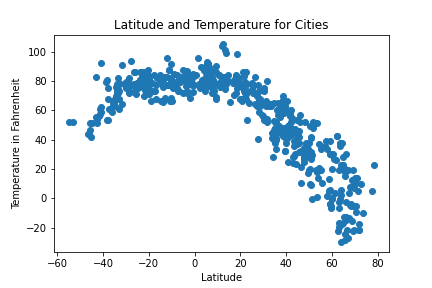
Next, I ran a linear regression on each relationship. For example, I showed what the linear regression was modeling for the Northern Hemisphere - Latitude vs. Temperature.