...
Data modelling is the process of analysing and defining all the different data your business collects and produces, as well as the relationships between those bits of data. The process of modelling your data creates a visual representation of data as it’s used at your business, and the process itself is an exercise in understanding and clarifying your data requirements.Data modelling is a technique used in NORMALIZING data ,that is breaking them down into a fact table and dimension table.
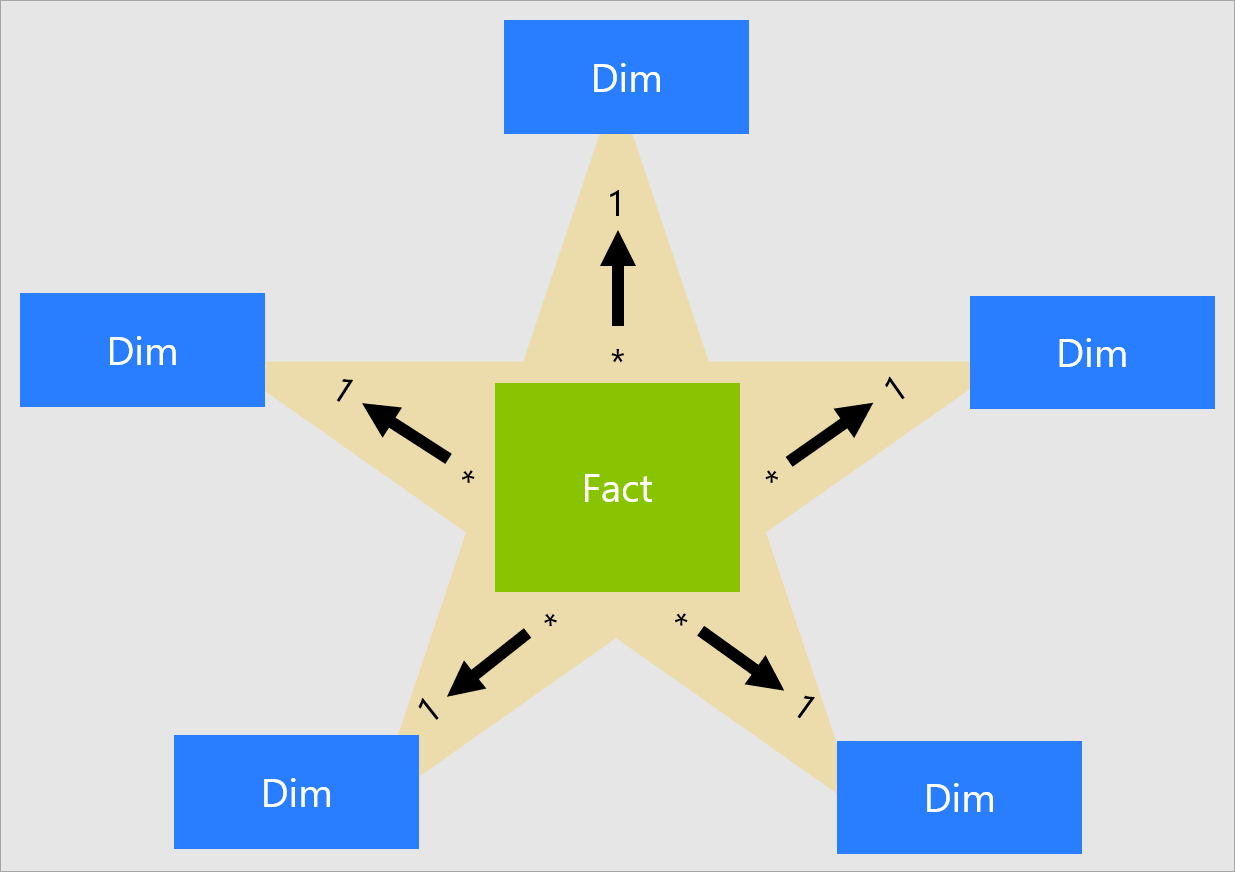
Fact Table: Contains data about an event, holding aggregated numeric data that you want to analyze. Dimension Table: Tables that keep metadata that describe the fact table that can be used to filter the fact table ; Typically in a data model you would have a single fact table and multiple dimension tables related to each other through keys.In other words fact table contains permanent data why dimenssion tables contains continuous data.
A denormalized data in excel
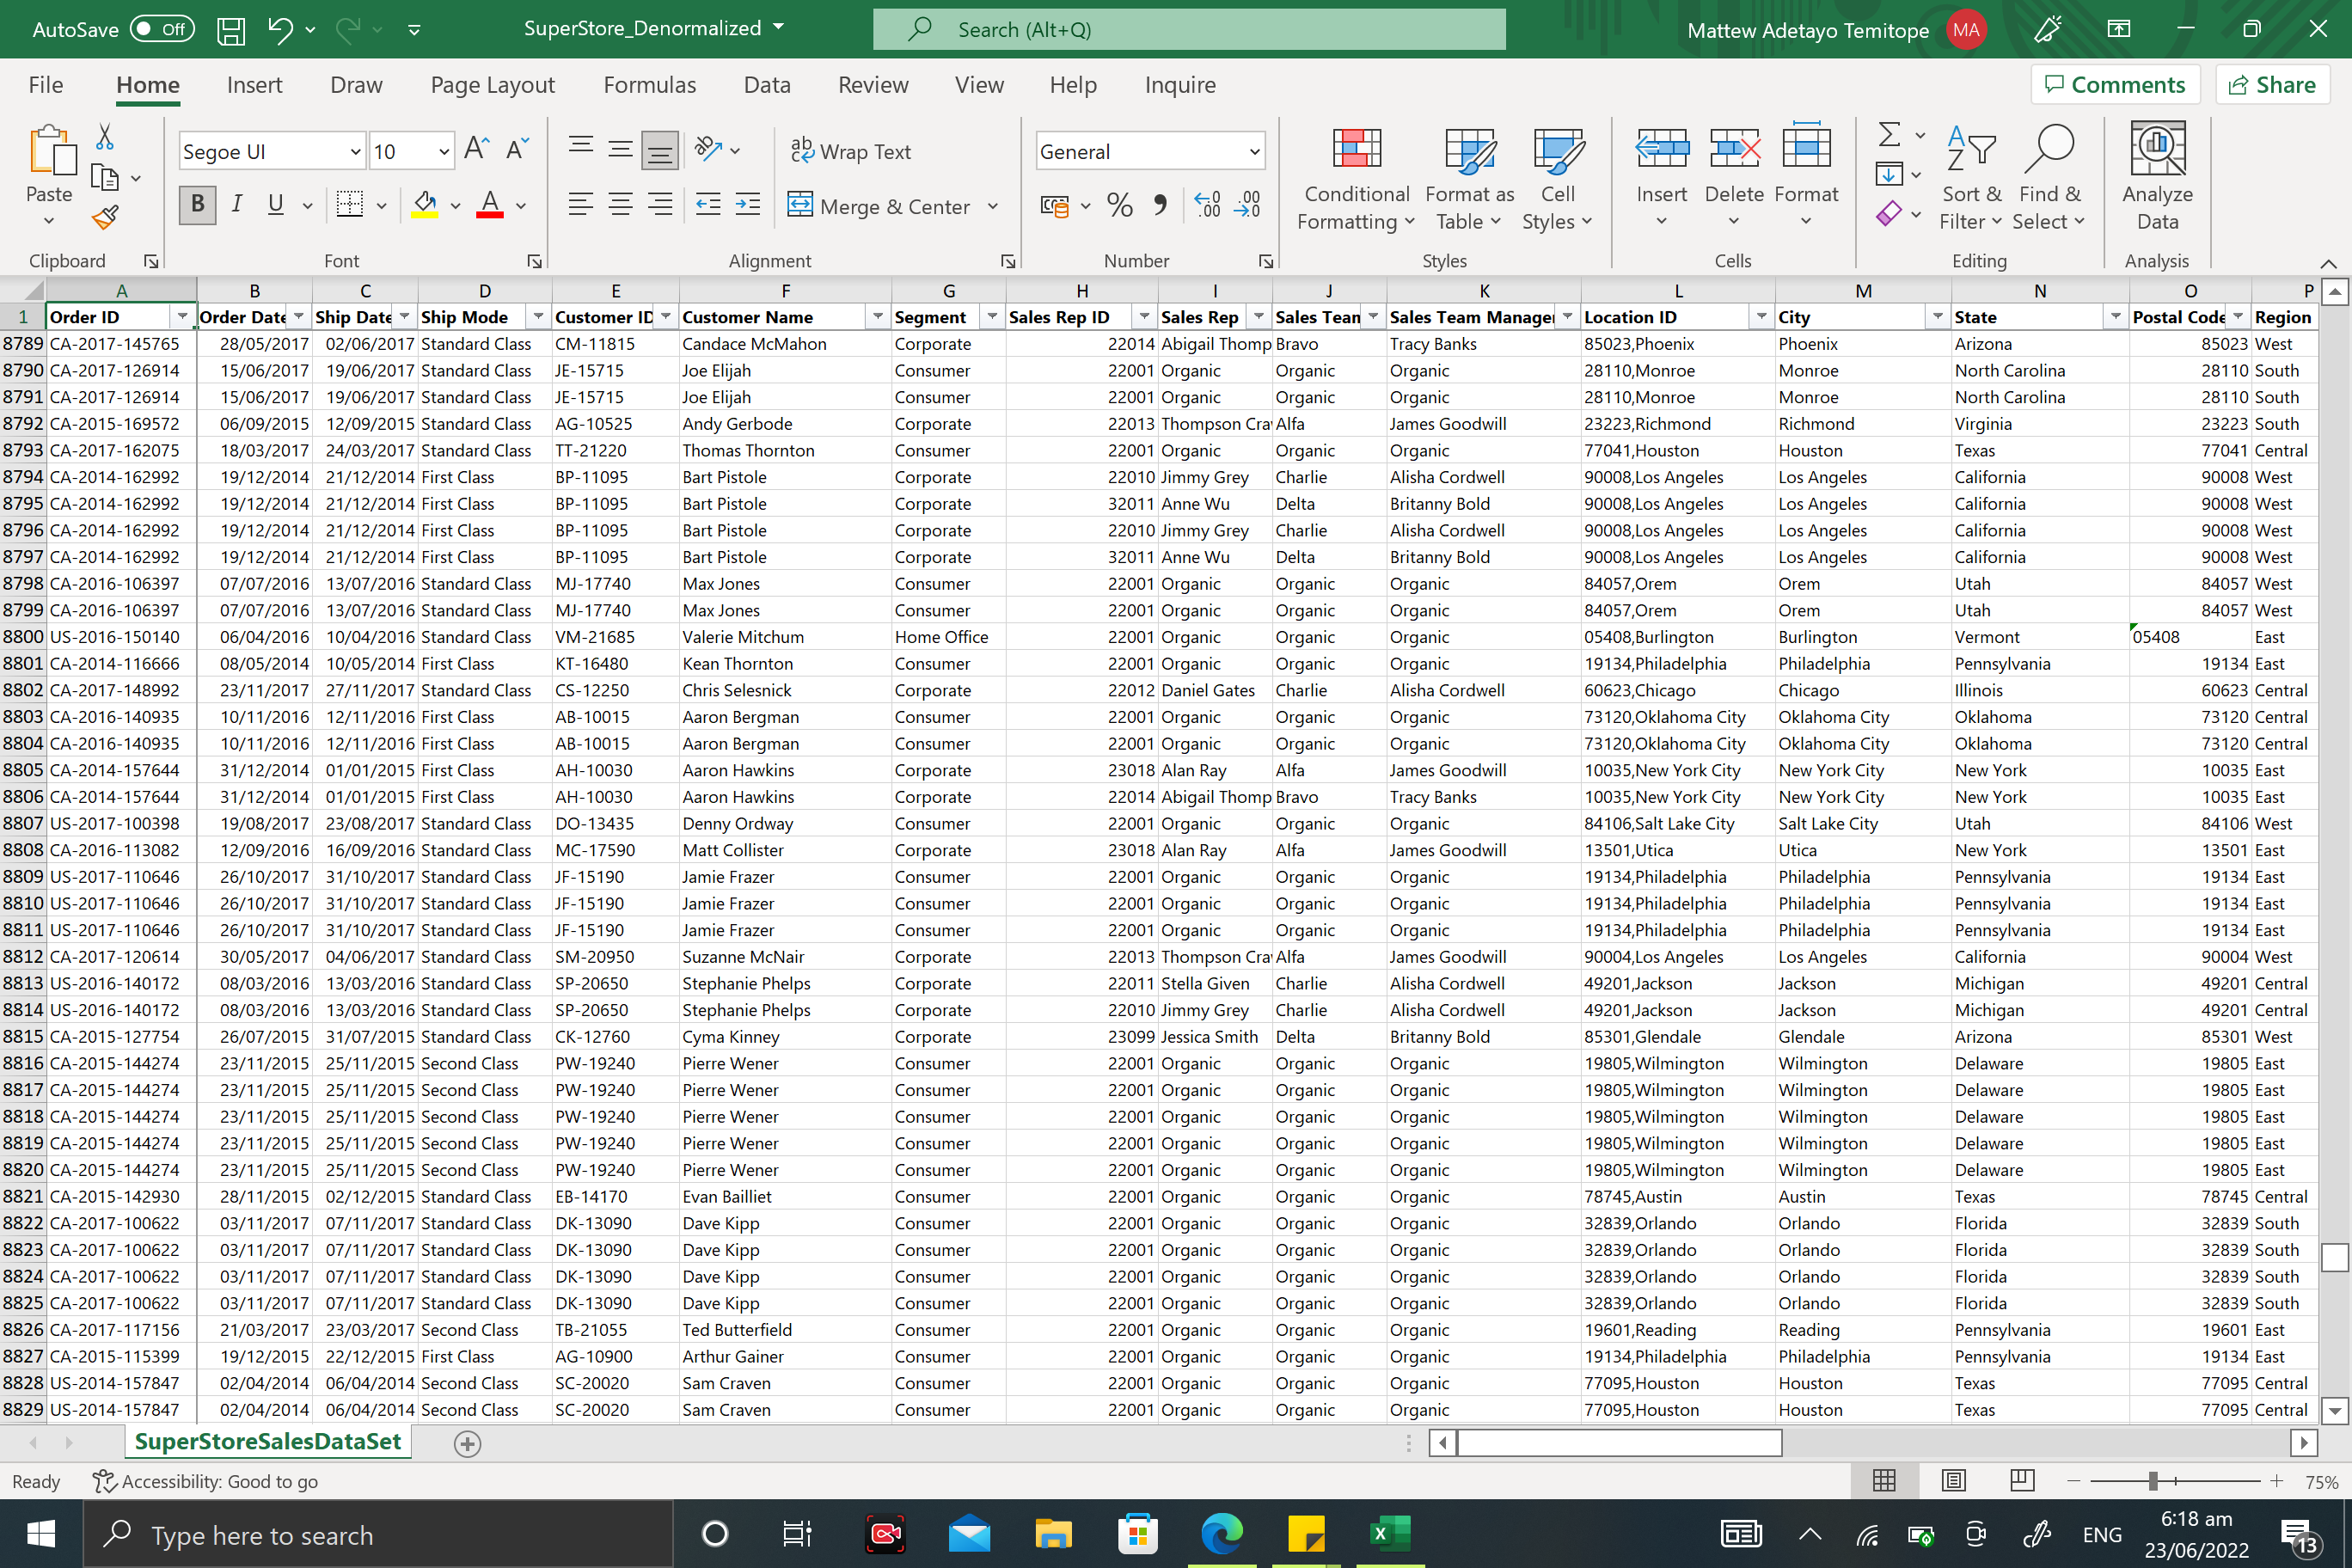
I normalised the data by breaking the data into the groups below
... 1 costumer table 2 Location 3 product table 4 sales rep table. this tables are called dimension table. The sales data contains unique keys(fAct table) that are both presents in the dimension table like the costumer id and so on...
After normalizing the data i head to powebi to open the data

I did some transormation on the product table data to change the first row to header and close and apply.
i then click on the model view tab in ecxel and finally connect the keys in the dimension tables to the fact table
