Compose Column Chart is an open source library for creating views of column charts in compose.
Add the code below to your gradle files
repositories {
    google()
    mavenCentral()
    maven { url 'https://jitpack.io' }
   ...
}

dependencies {
	implementation 'com.github.MarcinKap:Column-Chart-Compose:1.0.1'
}

To create a graph in your project you need to use a method called 'Chart' in which the obligatory parameter is the list of ChartSinglePart. So you have to make a list of such items.
data class ChartSinglePart(val columns: List<ChartColumn>, val description: String)
ChartSinglePart contains a description placed under the chart and a list of columns.
Each 'ChartColumn' object accepts values of int, color and 'informationToSend' of Any type (described later).
data class ChartColumn(val value: Int, val color: Color, val informationToSend: Any?)
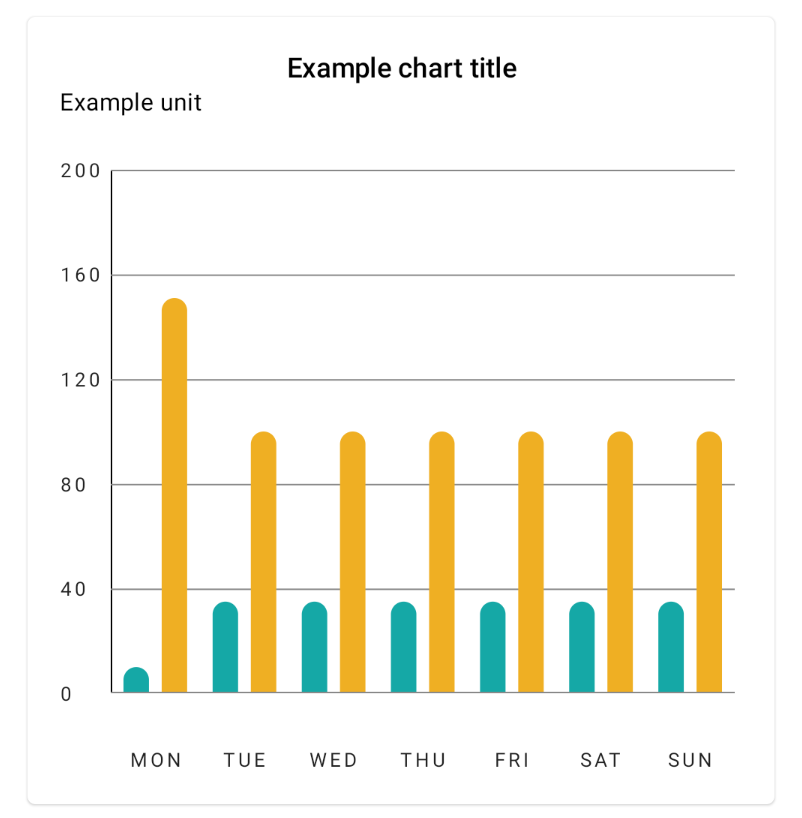
For example, the created list could look like this:
val listStats = listOf(
	ChartSinglePart(
	    columns = listOf(
		ChartColumn(
		    value = 10,
		    color = Color(0xff15a8a6),
		),
		ChartColumn(
		    value = 151,
		    color = Color(0xffefaf23),
		)
	    ),
	    description = "MON"
	)
)
The use of this list is as follows:
Chart(listStats = listStats)
Additional information contained in the ChartColumn (for example, a String with the name of the month and the chart number) can be used to send information about clicking on a given column. You should then overwrite the 'select' field. For example:
select = {
	val builder = AlertDialog.Builder(this@MainActivity)
	builder.setMessage(it as String)
	builder.show()
}
The result will be the added function of clicking on the graph.