Correlation Matrix in R
empty_m <- matrix(ncol = length(Telco_Customers), nrow = length(Telco_Customers), dimnames = list(names(Telco_Customers), names(Telco_Customers)))
calculate_cramer <- function(m, Telco_Customers) { for (r in seq(nrow(m))){ for (c in seq(ncol(m))){ m[[r,c]] <- assocstats(table(Telco_Customers[[r]], Telco_Customers[[c]]))$cramer } } return(m) }
cor_matrix <- calculate_cramer(empty_m,Telco_Customers)
cor_matrix
install.packages("corrplot") library(corrplot)
corrplot(cor_matrix, method = 'number')

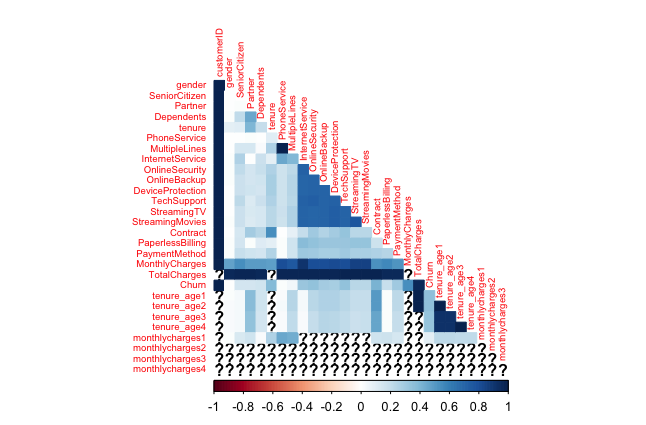
corrplot(cor_matrix, method = 'color', type = 'lower', diag = FALSE, tl.cex = .6)
df_corr <- Telco_Customers[,-c(1,19,20,21)] remove(empty_m,cor_matrix)
empty_m <- matrix(ncol = length(df_corr), nrow = length(df_corr), dimnames = list(names(df_corr), names(df_corr)))
calculate_cramer <- function(m, df_corr) { for (r in seq(nrow(m))){ for (c in seq(ncol(m))){ m[[r,c]] <- assocstats(table(df_corr[[r]], df_corr[[c]]))$cramer } } return(m) }
cor_matrix <- calculate_cramer(empty_m,df_corr) cor_matrix