Remote Debugging in Docker (with gunicorn) #4449
Description
| CPUs | Intel(R) Core(TM) i7-8650U CPU @ 1.90GHz (8 x 2112) |
|---|---|
| GPU Status | 2d_canvas: enabledchecker_imaging: disabled_offflash_3d: enabledflash_stage3d: enabledflash_stage3d_baseline: enabledgpu_compositing: enabledmultiple_raster_threads: enabled_onnative_gpu_memory_buffers: disabled_softwarerasterization: enabledsurface_synchronization: enabled_onvideo_decode: enabledwebgl: enabledwebgl2: enabled |
| Memory (System) | 15.93GB (3.37GB free) |
| Process Argv | |
| Screen Reader | no |
| VM | 0% |
When launching a remote debugging session, I see a bunch of threads that are running, and one is said to be Paused, yet the editor that normally displays the breakpoint doesn't show up. See here : 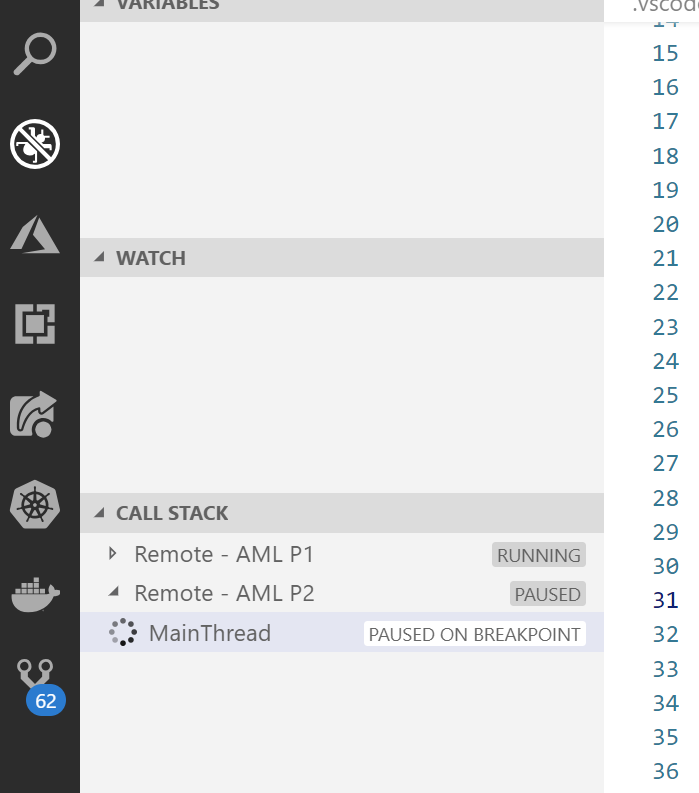
I see the one that shows the original, local file, but not the remote identical copy of the file that I normally see in a newly displayed code window (that if I hover the mouse over, I would see it's on, for example /home/user/...). And if I do right click on the MainThread I have the options to step over, into, ... and the debug displays seem to suggest that it's working. However it's not displayed and not being displayed makes it hard to follow. This was working before, and I'm not sure under what specific conditions this happens but I have a constant repro now (and am internal to the team). Just now, after about 5 minutes of not touching the VS Code window as I was typing here, it finally showed, but it is ultra slow whenever I press F10, and I don't get control back.
Moreover, if I stop the debugging sessions, the Call Stack keeps showing as busy and the Locals variables seem like they're also on hold somehow. See here :

I believe the process I'm debugging is gunicorn (I've embedded the "import ptvsd" inside of my training script running inside of Azure Machine Learning that builds a container that runs on gunicorn). This might be part of the issue as I've seen in issue 2138