Repository navigation
Home
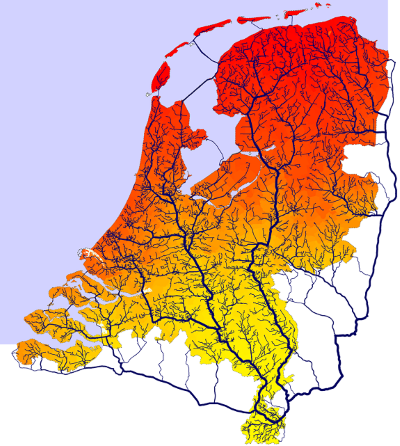
Accessibility is the ease with which relevant destinations can be reached from a given location. It is a driving factor in land use modelling, a policy indicator in its own right, and an input to a wide range of social, economic and environmental analyses.
This wiki is a method reference. It describes how accessibility is modelled: the concepts, the modelling choices, the indicators and the pitfalls, independently of any single project.
| Question | Where to look |
|---|---|
| Which accessibility indicator fits my research question, and what do I need to compute it? | This wiki |
| Which projects has Object Vision done on accessibility? | objectvision.nl, accessibility |
| How was the Dutch national network model built, with which data and for which modes? | Network model PBL |
| How is the worldwide network built from OSM, and what accessibility products does it produce? | NetworkModel World |
| How is the European network used for school and service accessibility and location optimisation? | NetworkModel EU |
| Which GeoDMS operator or function do I use, and what is its syntax? | geodms.nl documentation |
Examples in this wiki use the GeoDMS where a concrete implementation helps, but the methods themselves are software independent.
- Accessibility, what accessibility is, its four components and four measurement perspectives
- Travel impedance, cost, time and distance as the input to every accessibility measure
- Euclidean versus network distance, why "as the crow flies" is rarely good enough
- Network data sources, choosing between OSM, NWB, GTFS and other sources
- Building a routable network, from geometry to a connected, directed graph
- Network optimisation algorithm, reducing a network without changing its routing behaviour
- Travel speeds per mode, car, bicycle, pedestrian and public transport
- Zoning and spatial units, points, zones, grids, and the errors each introduces
- Connecting origins and destinations to the network, connectors, snapping and access time
- Shortest path and the Dijkstra algorithm, the routing core
- Origin Destination matrix (trip table), many origins to many destinations
- Isochrones and catchment areas, reachable areas and service areas
- Public transport routing, timetables as time expanded graphs
- Accessibility indicators, the indicator families side by side, and when to use which
- Distance decay functions, translating impedance into travel potential
- Spatial Interaction Models, the theory behind gravity and doubly constrained models
- Network centrality, centrality from random walker distributions
- Applications, projects and published indicators
- PC4 travel time matrix for Nederland van Boven (in Dutch), downloadable dataset
Pages marked (outline) state their intended scope but have not been written out yet. Contributions and corrections are welcome. This wiki is maintained by Object Vision BV.

Concepts
Networks
- Network data sources
- OSM
- NWB
- GTFS
- Building a routable network
- Network optimisation algorithm
- Travel speeds per mode
Origins & destinations
Computation
- Shortest path and the Dijkstra algorithm
- Origin Destination matrix (trip table)
- Isochrones and catchment areas
- Public transport routing
Indicators
Applications
Network models
Reference