Rendering issue graphs in Servicepulse Monitoring view #646
Description
Problem statement
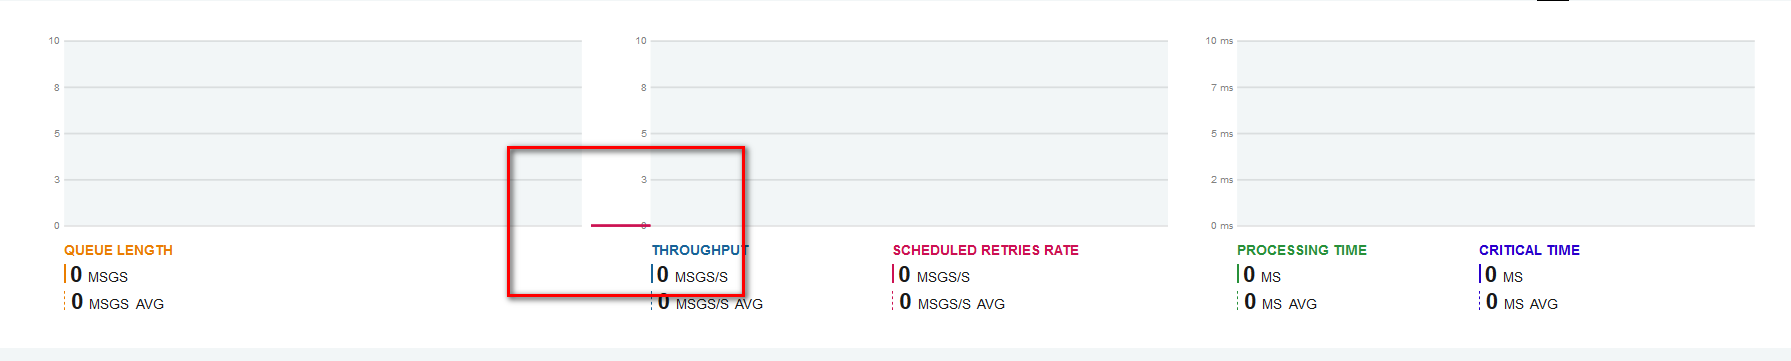
When there is no data for throughput but there is for retries the large graph displaying both of those values can be rendered on the left of the graph.
Reported Case
We just updated to the latest ServicePulse and ServiceControl version and experience a display issue when looking at the monitoring view.
In particular when displaying a single endpoint under Monitoring -> Select an endpoint.
Some of the graphs seem off and go off the grid, see the screenshot below:
It does not happen for all of our services but we can not figure out any pattern.
I tried different browsers and it persists in Firefox Quantum, Internet Explorer and Edge.
Thank you for looking into it.
Technical information if reporting a bug:
- ServicePulse version: v1.14.3
- ServiceControl version: v2.1.1
- Browser version: Firefox Quantum 59.0.2 (64-bit)