Data visualization is the visual presentation of data or information. The goal of data visualization is to communicate data or information clearly and effectively to readers.
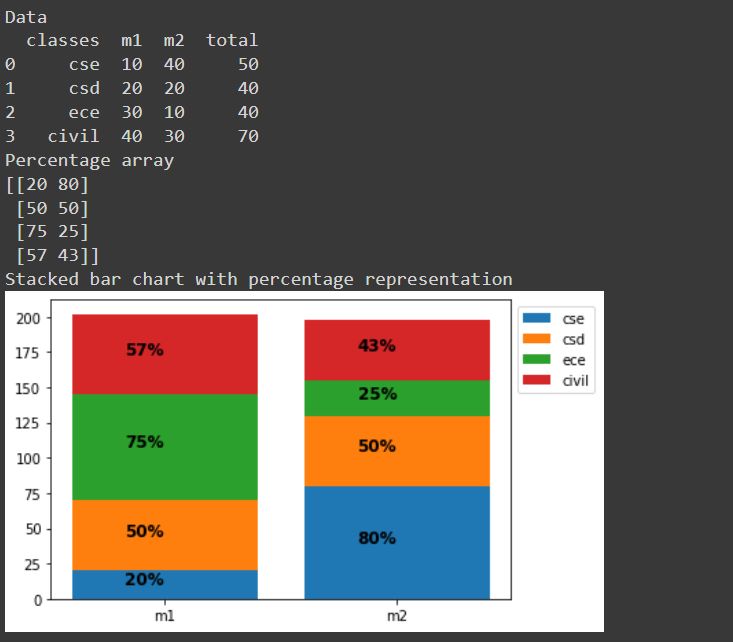
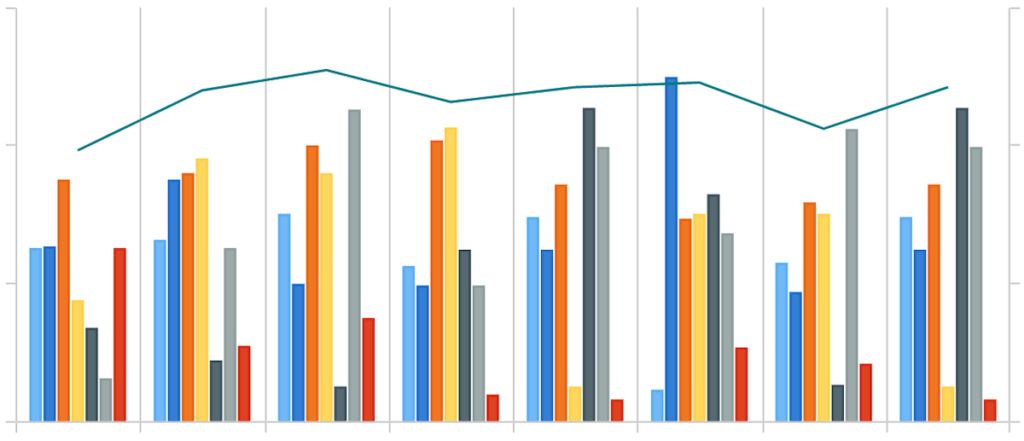 Project Description: The project is about visualizing the performances of different classes for multiple questions in an examination.This tells us how well each section performs compared to other sections which makes our comparisons and interpretations easier and quicker. Here is the Bar plot analysis for the sample data using python code.
-
Notifications
You must be signed in to change notification settings - Fork 0
SatyaNagaDevi07/Visualization-of-student-marks-in-python
Folders and files
| Name | Name | Last commit message | Last commit date | |
|---|---|---|---|---|
Repository files navigation
About
No description, website, or topics provided.
Resources
Stars
Watchers
Forks
Releases
No releases published
Packages 0
No packages published