Setup Nginx on Google Cloud
-
Update apt
sudo apt-get update -
Install nginx
sudo apt-get install nginx
- Get SSL-Certificate from provider.
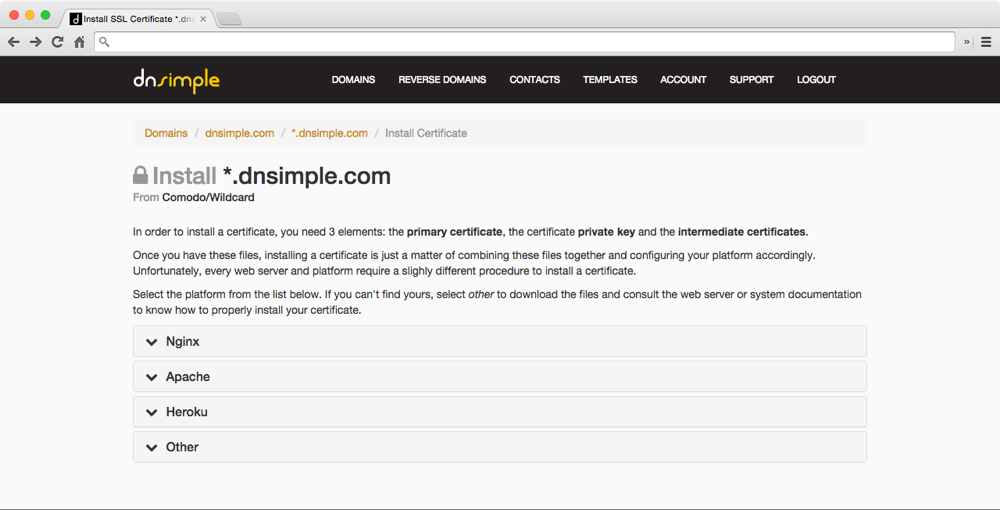
- DNSimple: Domains > drill down into your domain > Domain tab on left side > SSL Certificates header > drill down into your certificate > Certificate section > Install the SSL certificate > Enjoy the crisp / clear instructions
- Save .key and .pem in server
-
You may choose to use either
/etc/nginx/sslor/etc/ssl -
Example:
# on the SSH terminal for your gcloud machine
$ tree -L 1 /etc/ssl
/etc/ssl
├── certs
├── openssl.cnf
└── private

# on the SSH terminal for your local machine
$ gcloud compute instances list
$ gcloud compute copy-files ~/Downloads/MY_DOMAIN.key root@INSTANCE_NAME:/home/myUsername --zone
INSTANCE_ZONE
$ gcloud compute copy-files ~/Downloads/MY_DOMAIN.pem root@INSTANCE_NAME:/home/myUsername --zone
INSTANCE_ZONE

# on the SSH terminal for your gcloud machine
$ tree -L 1 /etc/ssl
/etc/ssl
├── certs
├── openssl.cnf
├── private
├── MY_DOMAIN_COM.key
└── MY_DOMAIN_COM.pem
$ ls -alrt /etc/ssl/
-rw-r-----  1 root root  7539 MY_DOMAIN_COM.pem
-rw-r-----  1 root root  1675 MY_DOMAIN_COM.key
-
Add a new virtual host or edit default
-
Redirect http traffic to https
server { listen 80; return 301 https://$host$request_uri; } -
Add ssl certificate
server { listen 443; ssl on; ssl_certificate /etc/nginx/ssl/<CERTIFICATE_PEM>; ssl_certificate_key /etc/nginx/ssl/<CERTIFICATE_KEY>; server_name <DOMAIN_NAME>; #Redirect application port to https location / { proxy_set_header Host $host; proxy_set_header X-Real-IP $remote_addr; proxy_set_header X-Forwarded-For $proxy_add_x_forwarded_for; proxy_set_header X-Forwarded-Proto $scheme; # Fix the “It appears that your reverse proxy set up is broken" error. proxy_pass http://localhost:<APPLICATION_PORT>; proxy_read_timeout 90; proxy_redirect http://localhost:<APPLICATION_PORT> https://<DOMAIN_NAME>; } } -
If you have never configured your nginx for anything at all before and you just want a sample that you can replace/override:
-
cp /etc/nginx/sites-available/default /etc/nginx/sites-available/default.backup -
vi /etc/nginx/sites-available/default(still requires substitutions based on your setup)
```
server {
    listen 80;
    return 301 https://$host$request_uri;
}
server {
  listen   443;
  ssl on;
    ssl_certificate /etc/nginx/ssl/MY_domain_com.pem;
    ssl_certificate_key /etc/nginx/ssl/MY_domain_com.key;
  server_name mySubDomainName.domain.com;
  location / {
    proxy_set_header        Host $host;
    proxy_set_header        X-Real-IP $remote_addr;
    proxy_set_header        X-Forwarded-For $proxy_add_x_forwarded_for;
    proxy_set_header        X-Forwarded-Proto $scheme;
    proxy_connect_timeout       600;
    proxy_read_timeout          1200;
    proxy_send_timeout          600;
    send_timeout                600;
    # Fix the "It appears that your reverse proxy set up is broken" error.
    proxy_pass          http://localhost:1337;
    proxy_redirect      http://localhost:1337 https://mySubDomainName.domain.com;
  }
}
```
- Test the Nginx configuration:
$ /etc/init.d/nginx configtest /etc/nginx/sites-available/default
 * Testing nginx configuration [ OK ]
-
Restart nginx
/etc/init.d/nginx restart ```
- All the files should be easily listable:
ls -alrt /etc/nginx/ - Have a peek at
cat /etc/nginx/sites-available/defaultto make sure that all is as you think it should be - You can also peek at
cat /etc/nginx/nginx.confto see where the log files for nginx go: /var/log/nginx/access.log/var/log/nginx/error.log- and
tailorlessthose files if needed for troubleshooting
- By default, a log format named
combinedis used:
log_format combined '$remote_addr - $remote_user [$time_local] '
                    '"$request" $status $body_bytes_sent '
                    '"$http_referer" "$http_user_agent"';
- Define a new one named
timed_combinedin/etc/nginx/nginx.conf
      log_format timed_combined '$remote_addr - $remote_user [$time_local] '
                                '"$request" $status $body_bytes_sent '
                                '"$http_referer" "$http_user_agent"'
                                '$request_time $upstream_response_time $pipe';

      # OR if you are optimizing for an aggregator like logentries which can do more with JSON
      log_format timed_combined '$remote_addr - $remote_user [$time_local] '
                                '"$request" $status $body_bytes_sent '
                                '"$http_referer" "$http_user_agent" '
                                '{'
                                '"request": "$request",'
                                '"status": "$status",'
                                '"request_time": "$request_time",'
                                '"upstream_response_time": "$upstream_response_time",'
                                '"pipe": "$pipe"'
                                '}';
- Next, modify access_log directive to use the new format:
access_log /var/log/nginx/access.log timed_combined;
- For example, my finished one looks like:
      log_format timed_combined '$remote_addr - $remote_user [$time_local] '
                                '"$request" $status $body_bytes_sent '
                                '"$http_referer" "$http_user_agent" '
                                '{'
                                '"request_time": "$request_time",'
                                '"upstream_response_time": "$upstream_response_time",'
                                '"pipe": "$pipe"'
                                '}';
      #access_log /var/log/nginx/access.log;
      access_log /var/log/nginx/access.log timed_combined;
- References:
- https://www.scalyr.com/community/guides/an-in-depth-guide-to-nginx-metrics
- https://lincolnloop.com/blog/tracking-application-response-time-nginx/
- https://blog.logentries.com/2014/08/json-logging-in-apache-and-nginx-with-logentries/
- Use logentries or papertrailapp or whatever to analyze your logs and aggregate the response-time metrics into a human readable report
- logentries queries:
1. To find logs whose last three values come after a double-quote (http_user_agent info ends with a double-quote) and are enclosed inside square-brackets:
/\" (\[.*\]) (\[.*\]) (\[.*\])$/1. To create a graph by introducing captcha groups(named grouping) into the query, switch to advanced mode anf use:where(/\" (?P<request_time>\[.*\]) (\[.*\]) (\[.*\])$/) groupby(request_time)