Repository navigation
User Manual Results
Covers Runs, Groups, Compare, and Experiments — everything about viewing, pooling, and
statistically comparing finished benchmark runs. Screenshots below are from the live deployed instance
at ace.strgm-ai.com. See Architecture and
Features for how a run's score is actually
computed.
Open Runs (route /runs) — the landing page — to browse every already-produced
results/<run-id>/ directory, whether it came from a job run on this instance or was imported.
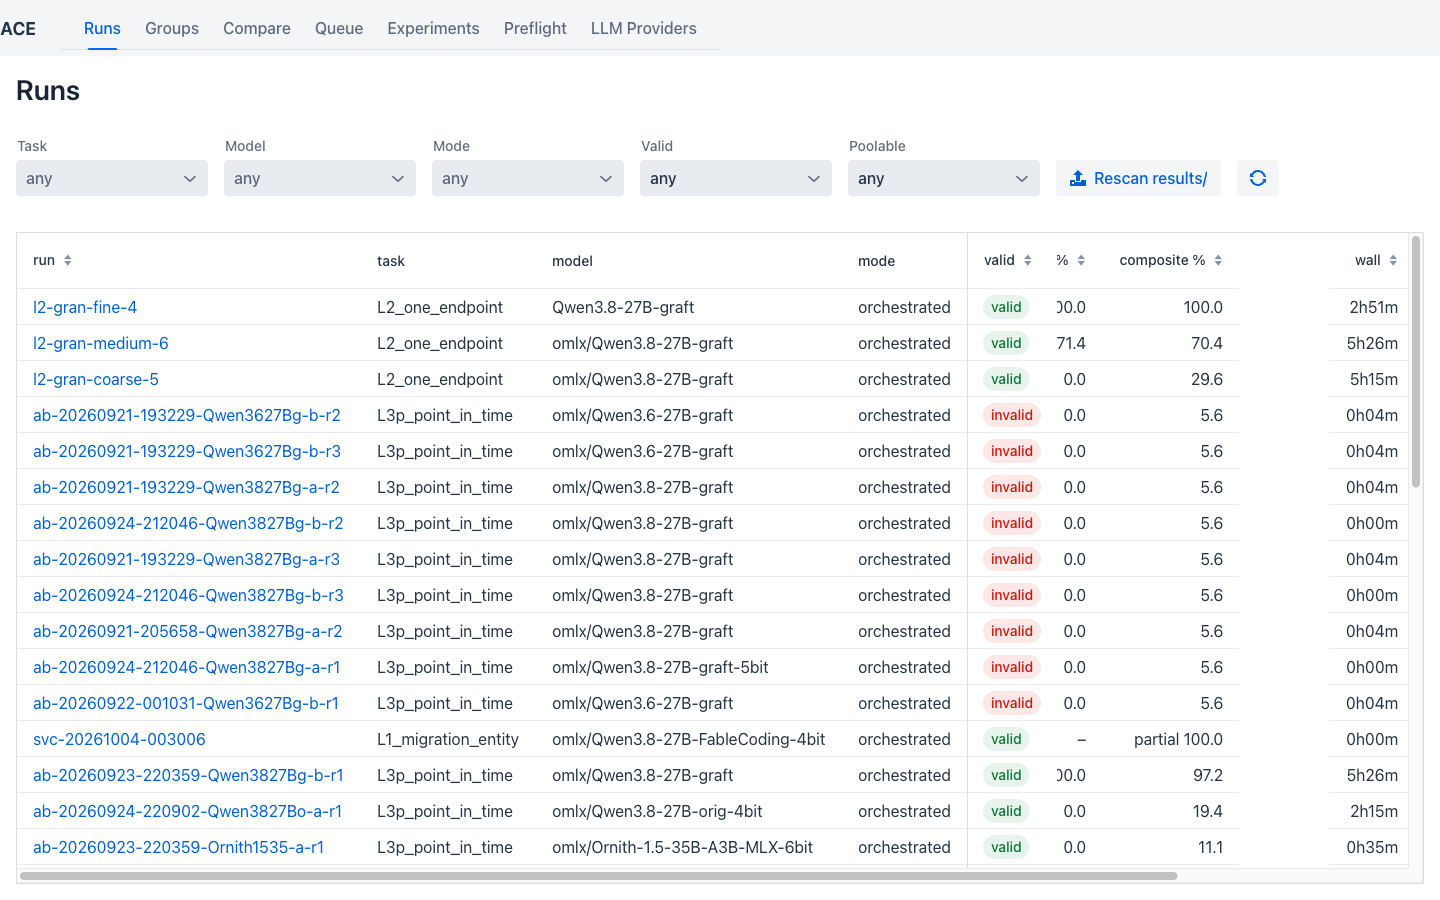
Filters across the top (Task / Model / Mode / Valid / Poolable) narrow the list server-side. Rescan results/ re-imports anything in the results directory that isn't in the database yet; the refresh icon just reloads the current list. Each row links to that run's detail page.
Clicking a run id opens its detail page (route /runs/:runId).
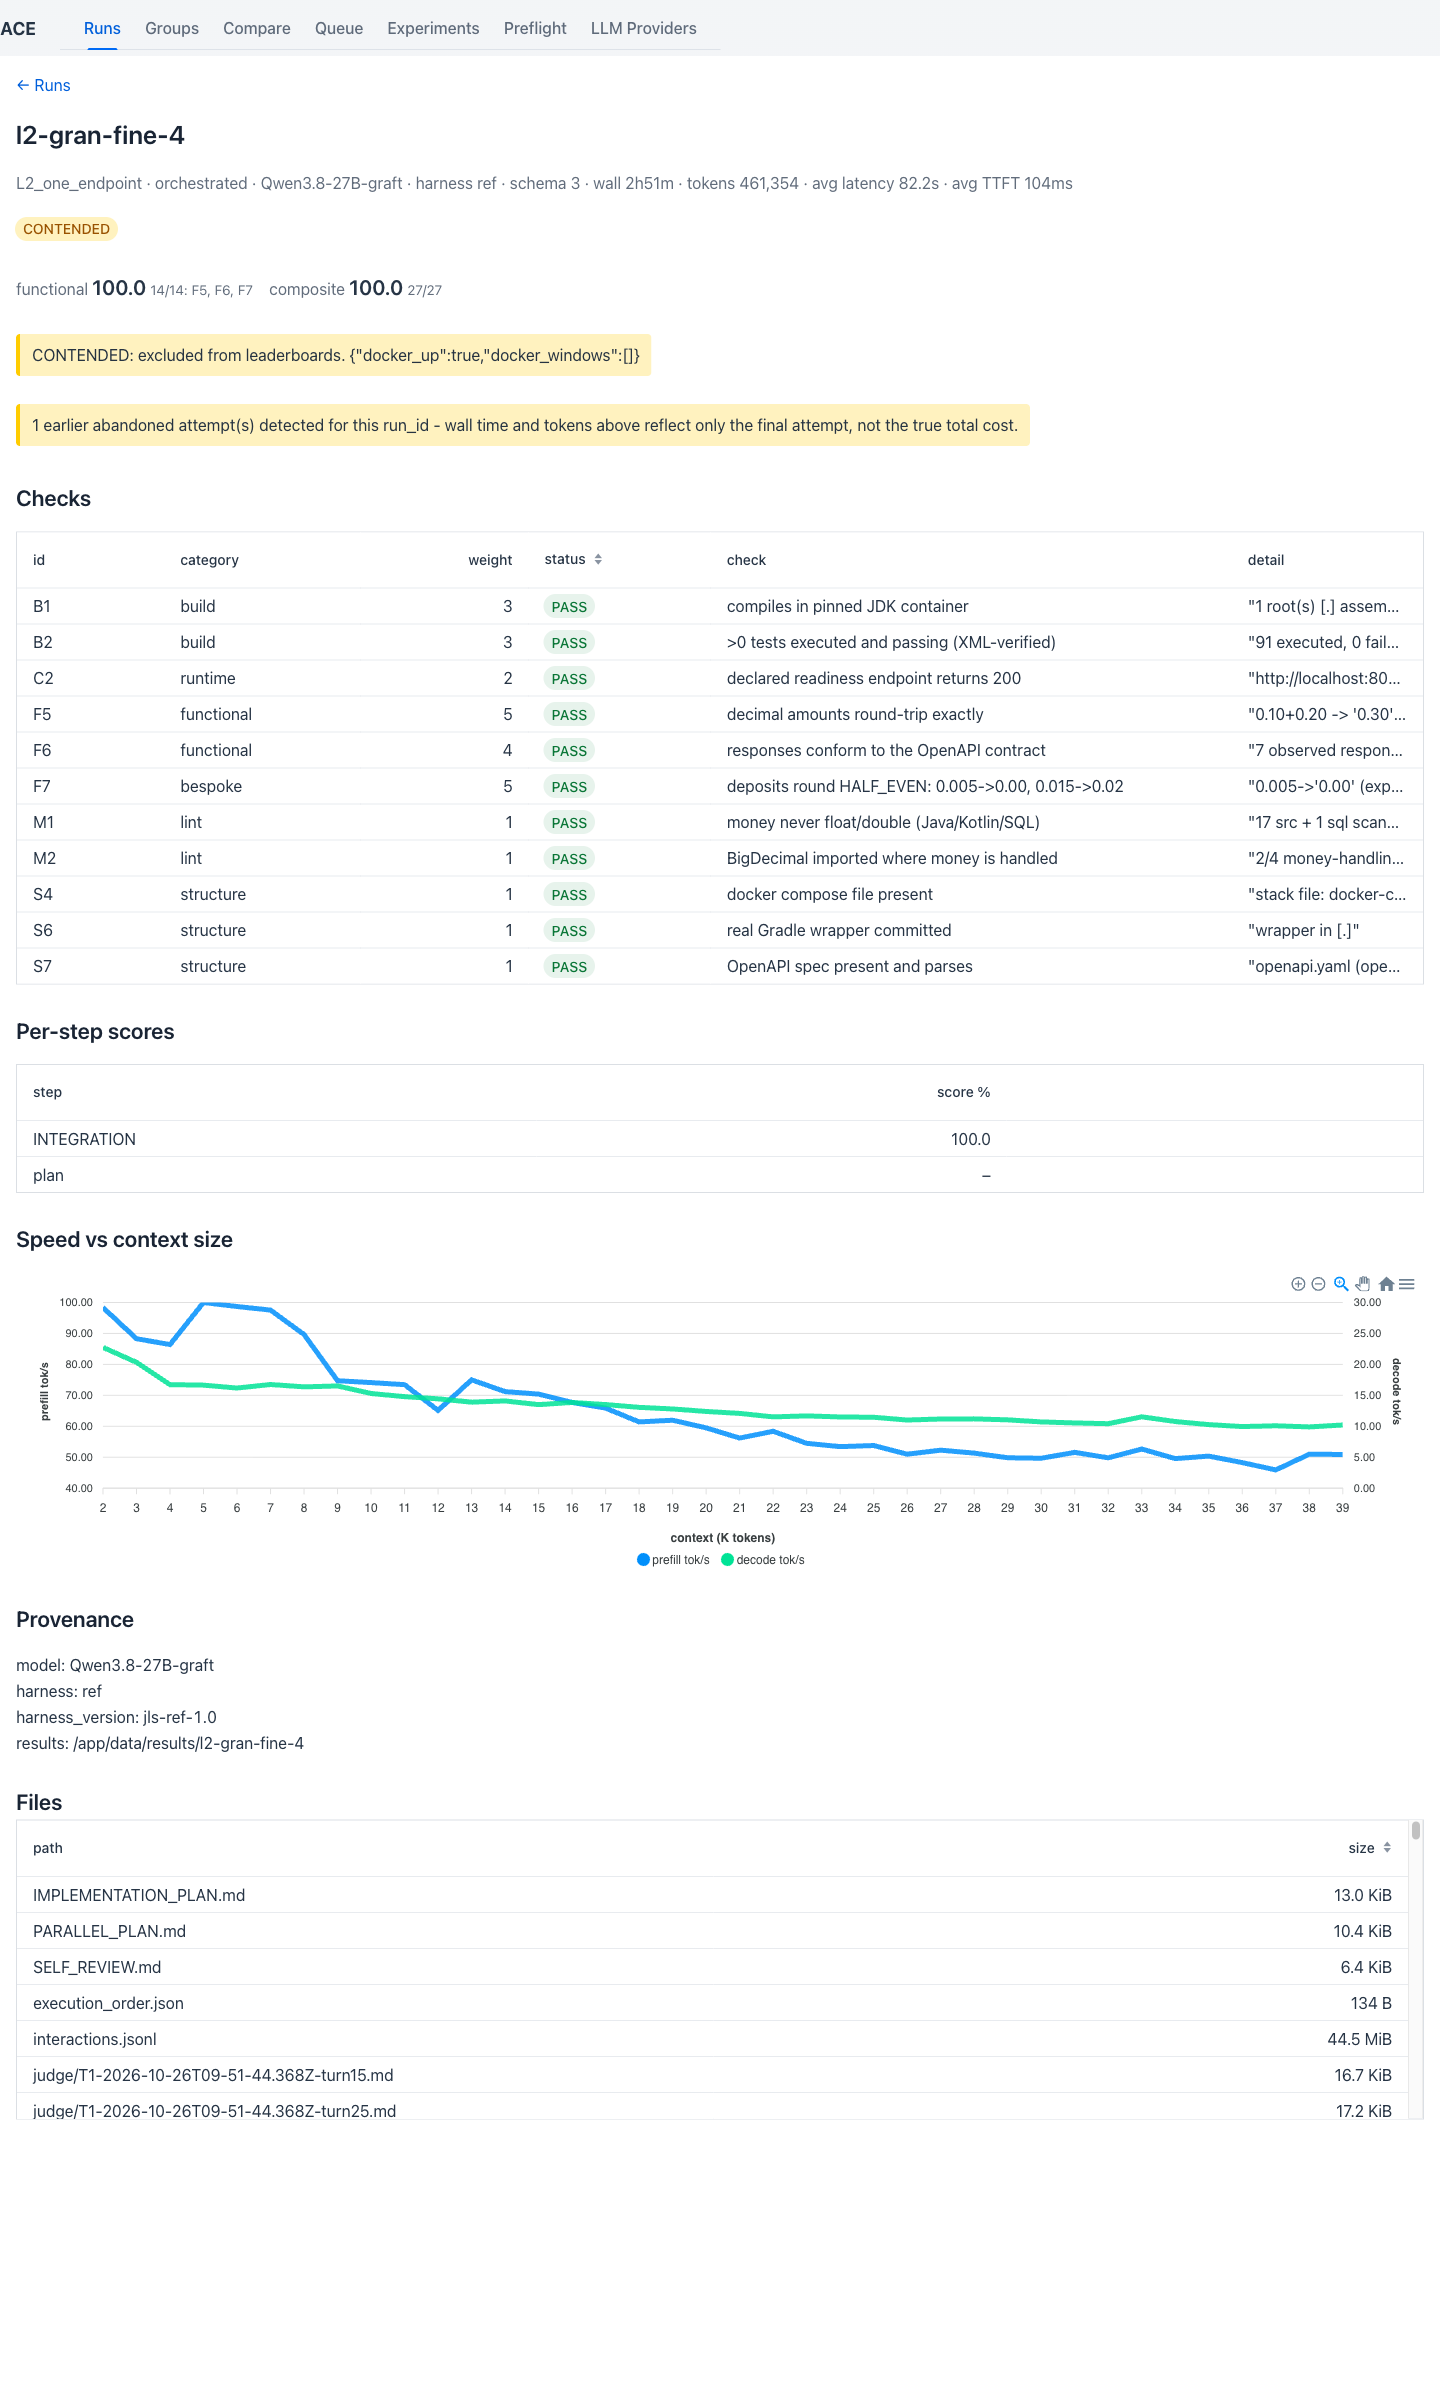
Top to bottom: title and meta line (task / mode / model / harness / schema / wall time / tokens / average latency / average TTFT), validity and contention badges, the two headline numbers (functional and composite — or a single partial number if the run was never fully scored, see Design Decisions), then:
-
Checks — every check id this run was scored against, with its category, weight, status, and a
human-readable detail string (e.g.
"91 executed, 0 failed, rc=[0]"for B2). Clicking a row opens its full detail. -
Per-step scores — a score for each pipeline step (e.g.
INTEGRATION) where that's meaningful. - Speed vs context size — a chart of prefill/decode tokens-per-second against context-size buckets, for this run's own model/setup.
- Compaction overhead over time — cumulative compaction overhead (seconds) against elapsed run time.
- Provenance — model, quantization, harness and harness version, harness/oracle SHAs, oMLX version, Java version, measured usable context window, review cost lines, and the results directory path on the server.
-
Files — an embedded browser over the run's own results directory (manifests,
interactions.jsonl, every Judge checkpoint file, etc.), each entry openable in a standalone file viewer that renders Markdown and pretty-prints JSON/JSONL.
If a run id doesn't have results yet, this page instead shows a self-service panel pointing at whatever's actually blocking it (an in-flight job, a paused job, a job that ended without a score, or a plain "Rescan results/" button if there's no known job at all).
Open Groups (route /groups) for the leaderboard: runs pooled by (task, model, config key) — the
key is a hash of the run's configuration, not its mode. See Features
for the exact pooling rule.
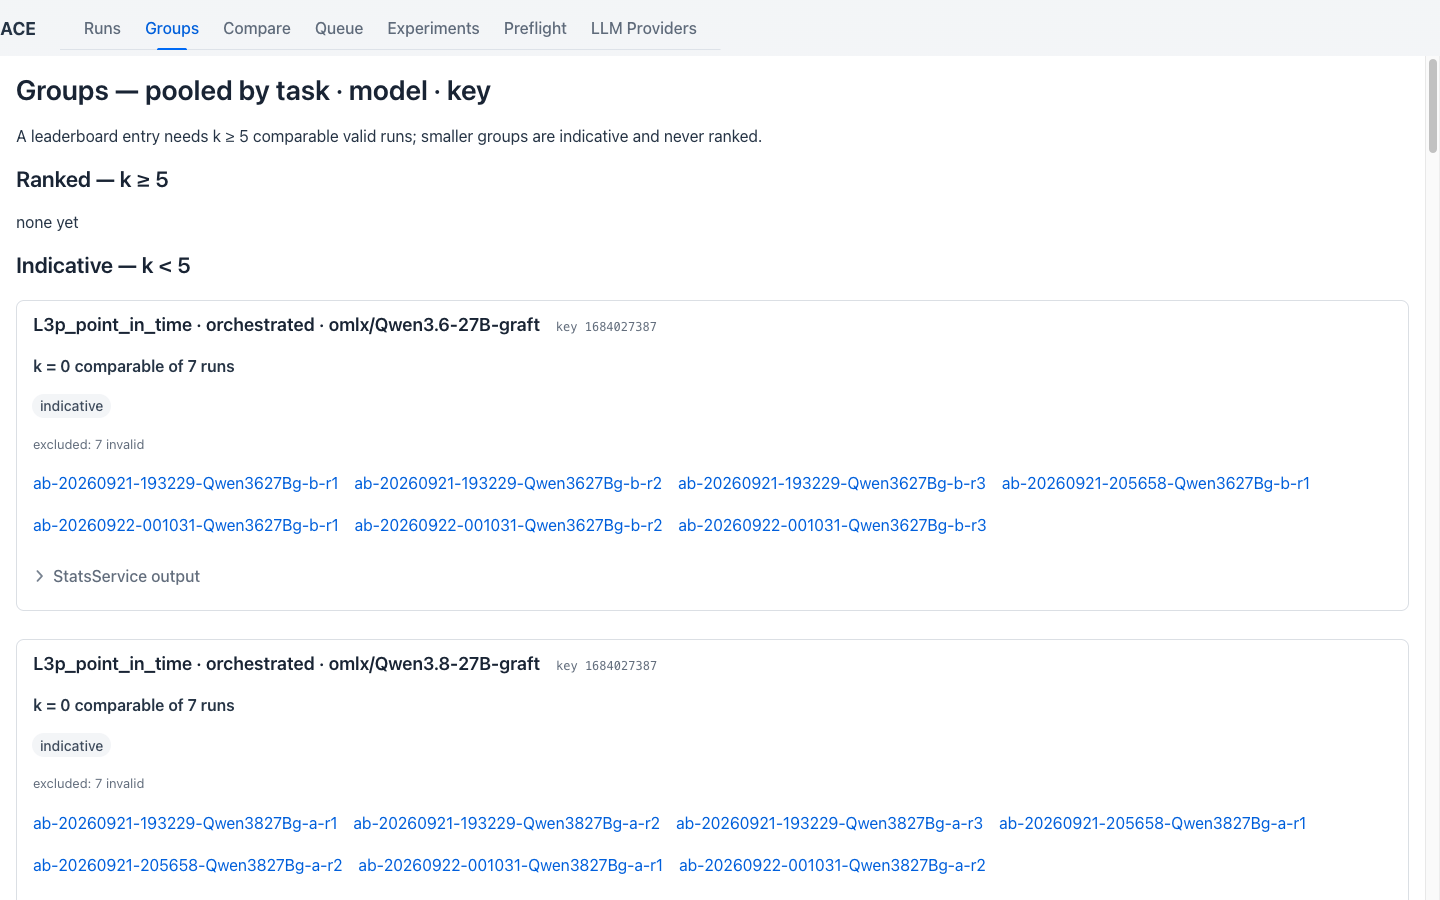
Two sections: Ranked — k ≥ 5 (groups with at least 5 comparable valid runs, the only ones eligible
to be ranked) and Indicative — k < 5 (shown for visibility, never ranked — see
Design Decisions, rule 8). Each card shows how
many of the group's total runs were actually comparable (with an excluded-run breakdown — invalid,
or partial due to a Docker skip/infra failure), mean functional/composite/agent-result scores with 90%
confidence intervals, a per-check pass/fail chip row, links to every contributing run, and a
collapsible raw StatsService output panel.
Open Compare (route /compare) for two independent tools on one page.
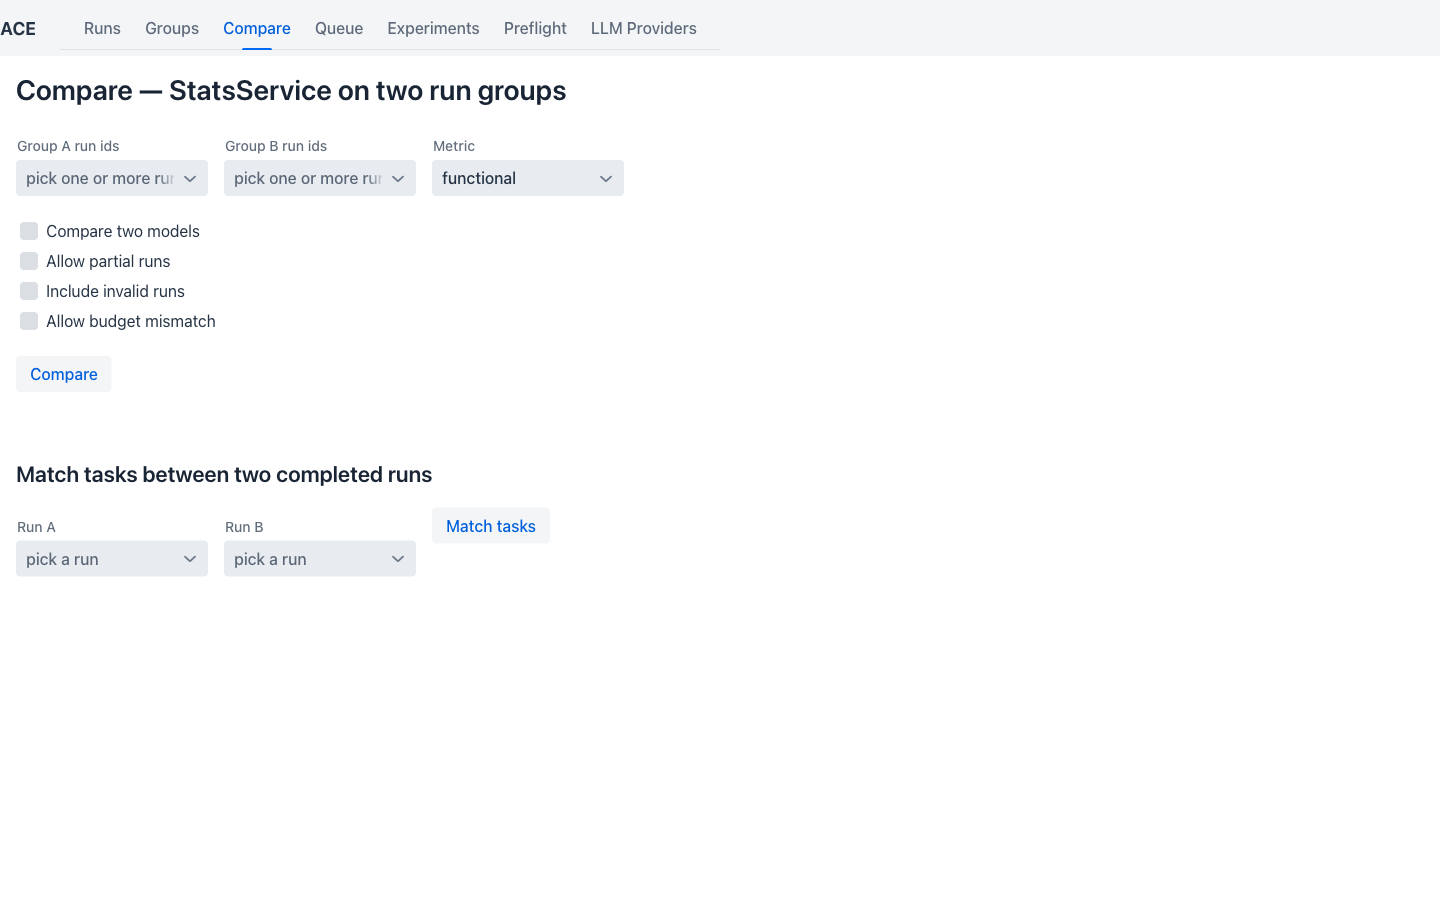
Statistical comparison — pick Group A and Group B (multi-select run-id pickers, restricted to
poolable runs), a metric (functional/score/agent_result), and any of four comparability
checkboxes: Compare two models (switches from a budget-match requirement to a harness-identity
check), Allow partial runs, Include invalid runs, Allow budget mismatch. Compare returns
StatsService's verdict — a bootstrap confidence interval and permutation-test result — plus the raw
output for inspection.
Task matching — a separate tool further down the page: pick Run A and Run B (not restricted to
poolable runs) and press Match tasks to run TaskMatcher's LLM-based semantic alignment between
two independently-decomposed plans (see Architecture §13),
returning a table of which task in A corresponds to which task in B (or "no match").
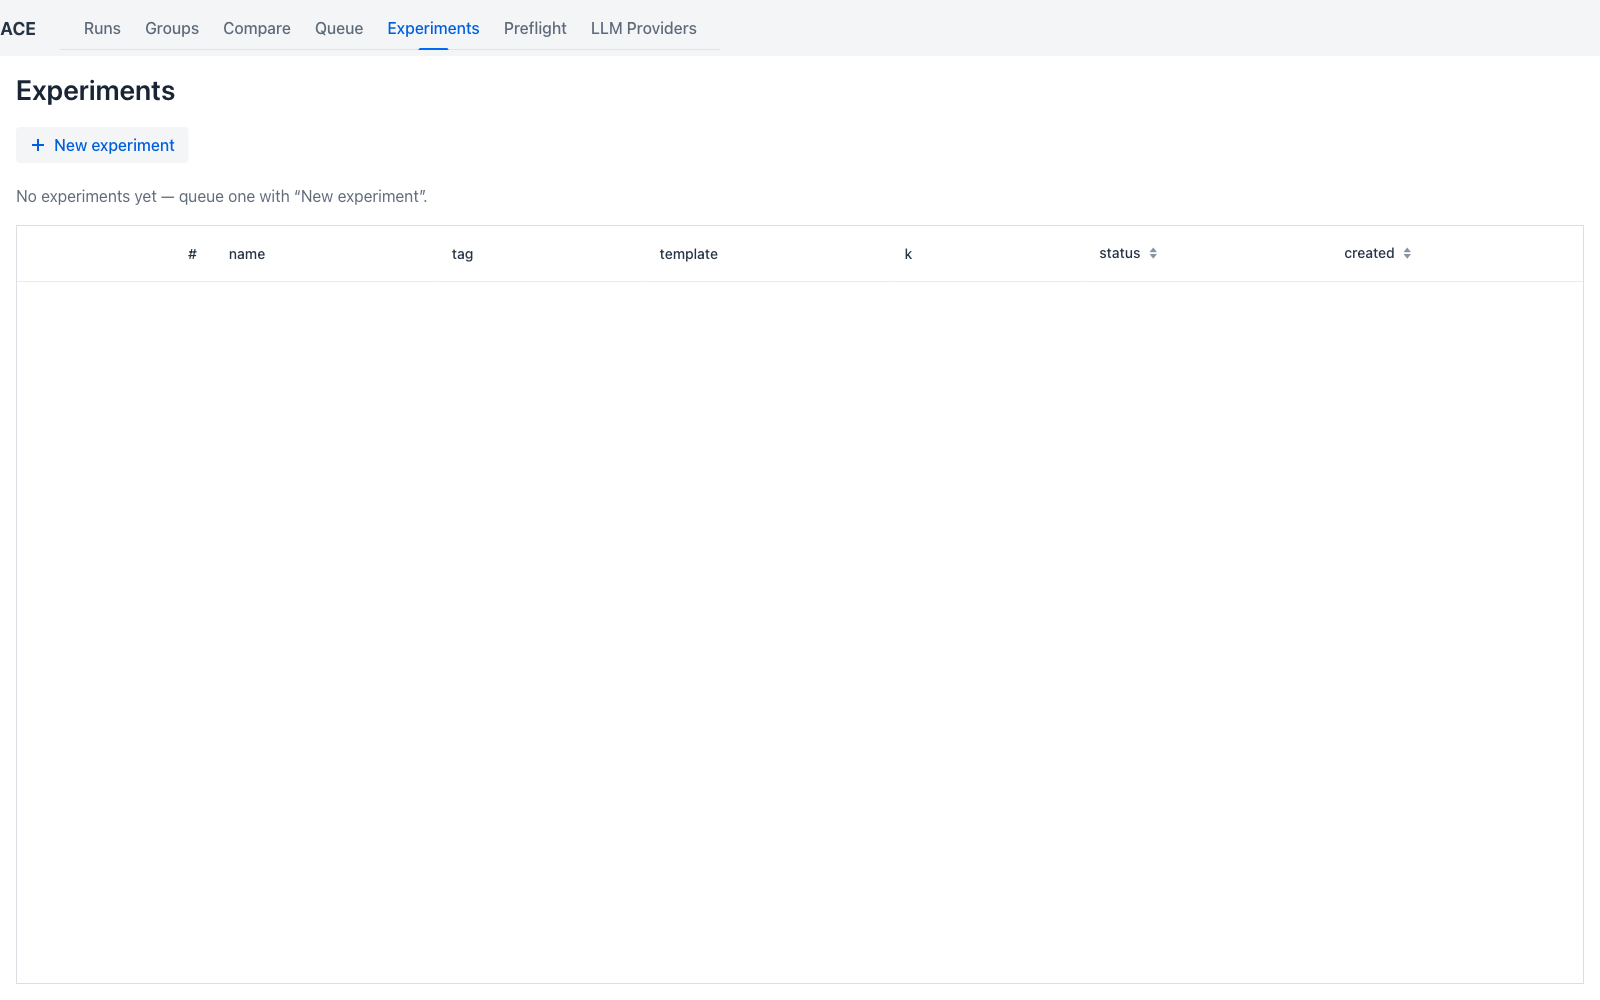
Open Experiments (route /experiments) for templated, repeated, automatically-compared batches of
jobs.
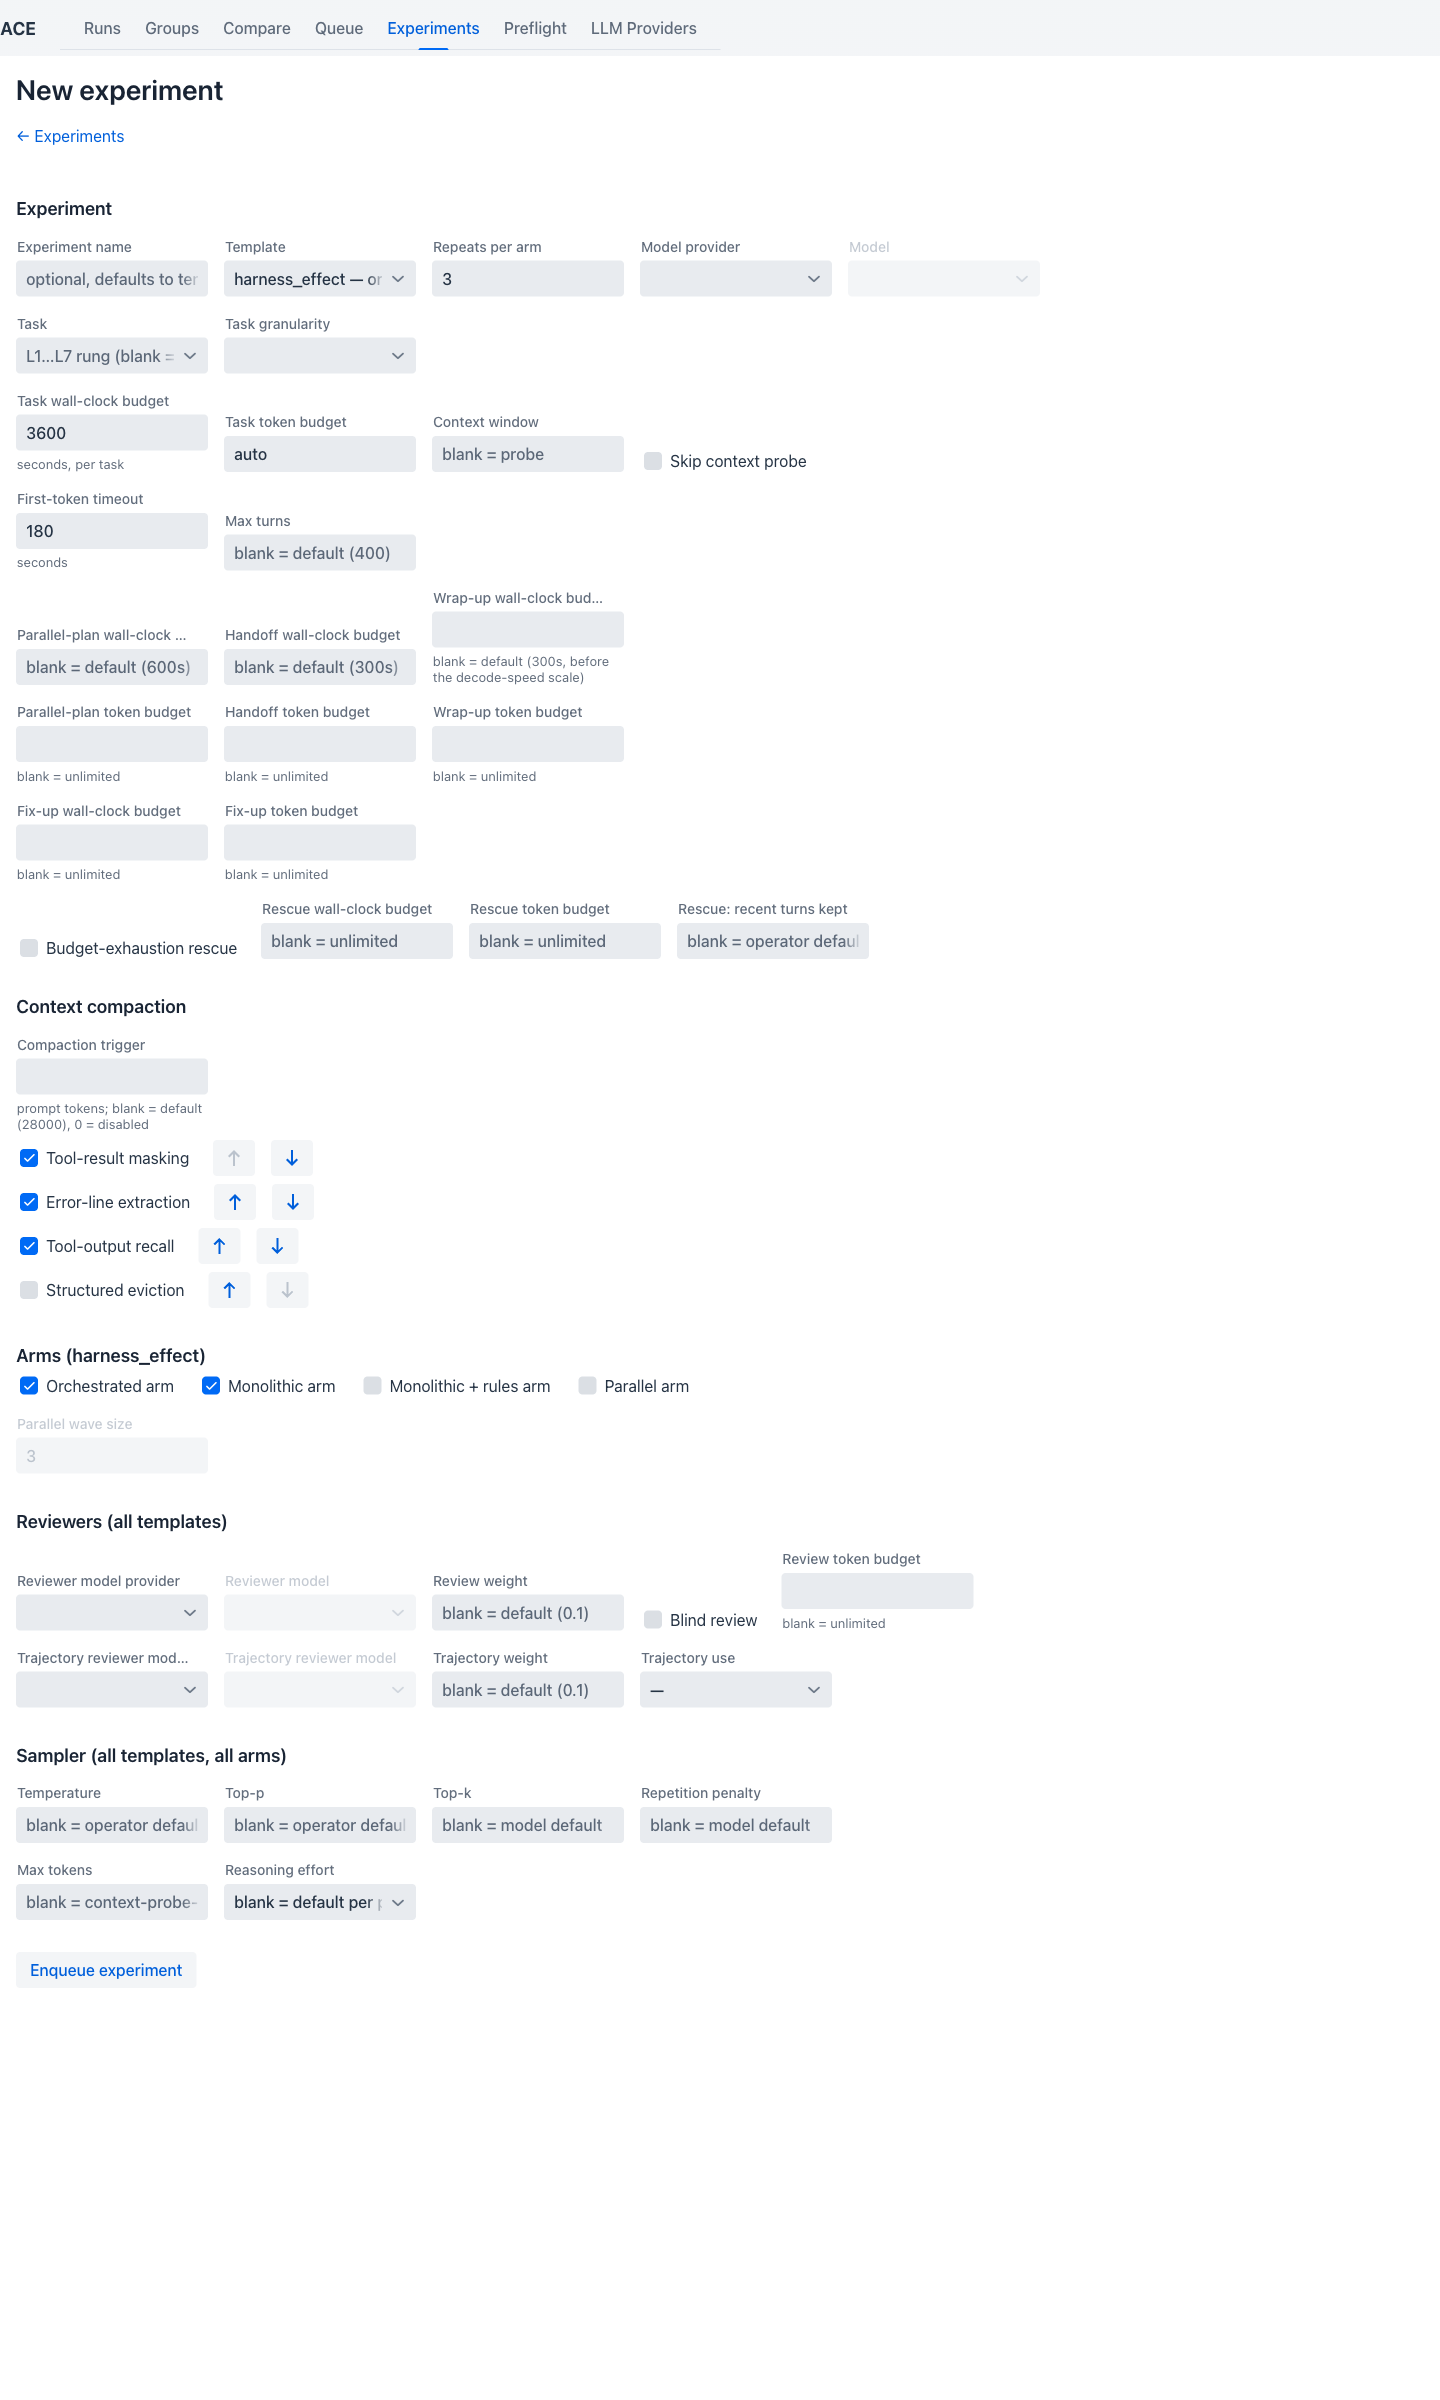
New experiment opens the creation form, with three templates, each changing which arm-specific section appears below the shared fields:
| Template | Compares |
|---|---|
harness_effect |
One model across multiple harness arms — orchestrated / monolithic / monolithic+rules / parallel |
model_ab |
Two models, same harness and budgets |
agent_ab |
The reference agent vs. Pi, same model and budgets |
Shared fields cover the same budgets/compaction/reviewer/sampler settings as a single job (see
User Manual: Jobs), plus Repeats per arm (k, default 3) — this is what lets
an experiment's own comparison reach statistical significance on its own, without waiting for the
Groups leaderboard to accumulate k ≥ 5 independently.
Once every job in an experiment reaches a terminal state, its detail page (/experiments/:id) shows a
Comparison section — one card per arm pair, with a verdict like "A − B = 4.2 functional points ·
90% CI [1.1, 7.3] · p = 0.031 · supported (p < 0.10)", alongside each arm's own jobs grid (status
and result per repeat) and the raw parameters used.
- User Manual: Jobs — creating a job, the job detail page, the per-task dialog
- User Manual: Providers — configuring a provider, Preflight
- Architecture, Features, Design Decisions