Repository navigation
UltraPlot 2.7.3: Hotfix for colormaps not setting bad values in matplotlib 3.11.x

UltraPlot 2.7.3 fixes colormap handling of bad values with Matplotlib 3.11 and adds raincloud plots for comparing distributions.
New Features
- Raincloud plots (
ax.raincloud): Show distribution shape, individual observations, and summary statistics in one call. A half violin forms the cloud, jittered points show the observations, and a narrow boxplot marks the median and interquartile range. Use vertical or horizontal layouts, place the cloud on either side, and style or hide each component independently. The method supports arrays, DataFrame columns, unequal sample sizes, and reproducible jitter, with no new dependencies (#844).
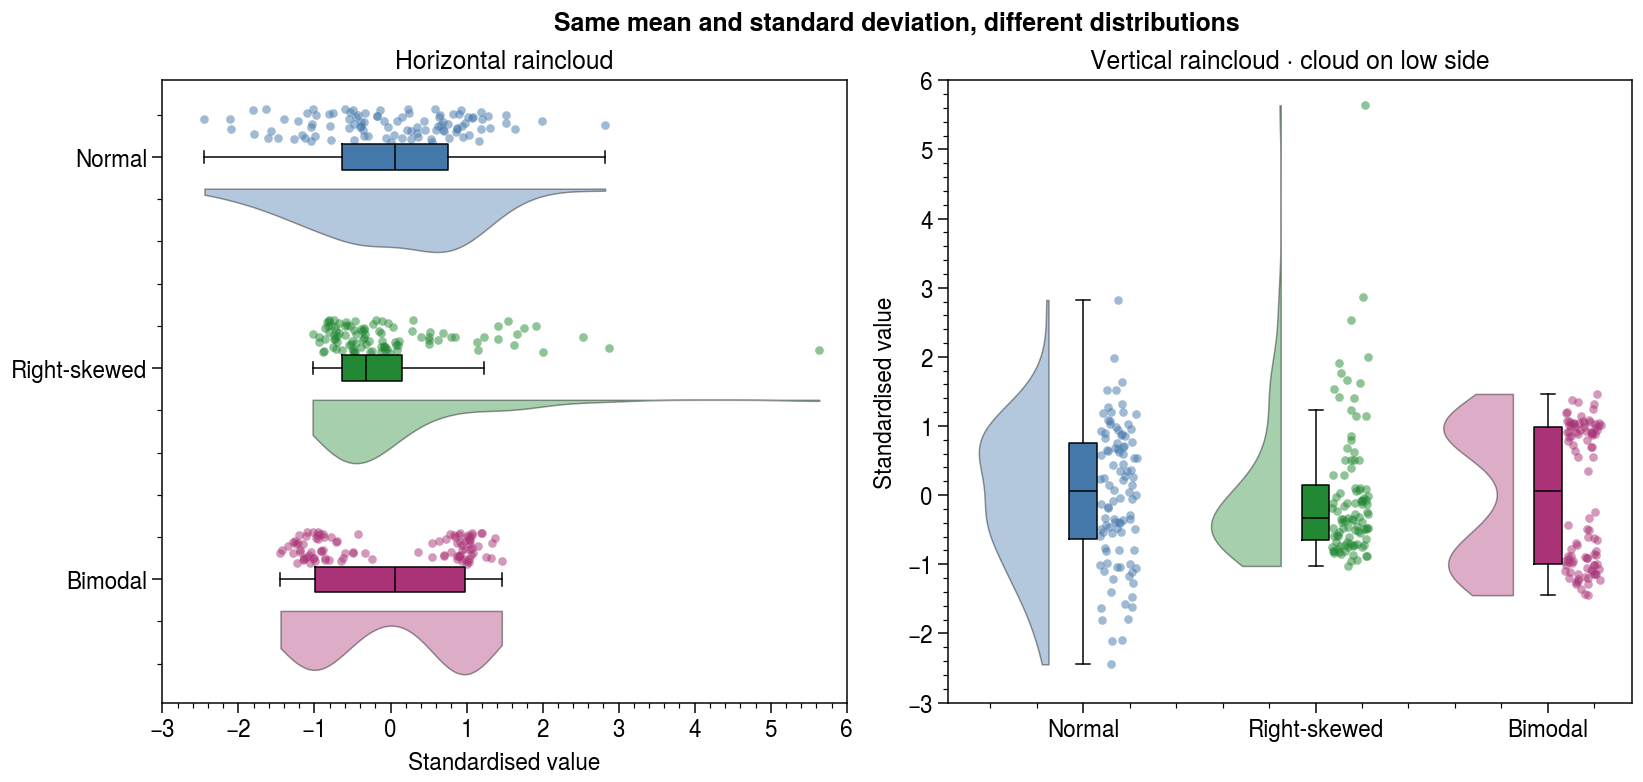
Each synthetic sample contains 100 observations, standardised to the same sample mean (0) and standard deviation (1). The half violins reveal the different shapes that these two summary statistics conceal, while the points and boxes keep individual observations and quartiles visible. Both the observations and point jitter use fixed seeds.
snippet: horizontal and vertical raincloud plots
import numpy as np

import ultraplot as uplt

# Fixed seeds make both the observations and the point positions reproducible.
rng = np.random.default_rng(42)
data = np.column_stack(
    [
        rng.normal(size=100),
        rng.lognormal(mean=0, sigma=0.65, size=100),
        np.r_[rng.normal(-1.2, 0.3, 50), rng.normal(1.2, 0.3, 50)],
    ]
)
data = (data - data.mean(axis=0)) / data.std(axis=0, ddof=1)
labels = ["Normal", "Right-skewed", "Bimodal"]
colors = ["#4477AA", "#228833", "#AA3377"]
limits = (np.floor(data.min()), np.ceil(data.max()))

fig, axs = uplt.subplots(ncols=2, refwidth=3.8, refaspect=1.1, share=False)

artists = axs[0].raincloud(
    data,
    labels=labels,
    orientation="horizontal",
    cycle=colors,
    seed=7,
)
axs[0].format(
    title="Horizontal raincloud",
    xlabel="Standardised value",
    yreverse=True,
    xlim=limits,
    grid=False,
)

axs[1].raincloud(data, labels=labels, cycle=colors, side="low", seed=7)
axs[1].format(
    title="Vertical raincloud · cloud on low side",
    ylabel="Standardised value",
    ylim=limits,
    grid=False,
)
axs.format(suptitle="Same mean and standard deviation, different distributions")
fig.show()
What's Changed
- Bump basedpyright from 1.40.1 to 1.40.2 in the python-dependencies group by @dependabot[bot] in #842
- Derive Matplotlib CI versions from dependency bounds by @cvanelteren in #843
- Docs: clarify Cartopy gridline label overlap and UltraPlot overrides by @cvanelteren in #846
- Fix small issue where a render whas sharing across different projections by @cvanelteren in #847
- CI: upload only failed image comparisons by @cvanelteren in #850
- Add raincloud plots combining half violins, observations, and boxplots by @cvanelteren in #844
- Explicitly declare package data in pyproject.toml by @munechika-koyo in #838
- Fix the ordering of initializing lut due to change in mpl version by @cvanelteren in #849
Full Changelog: v2.7.2...v2.7.3
Contributors


cvanelteren, dependabot, and munechika-koyo