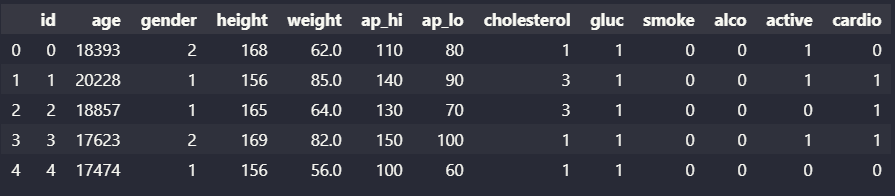
In this challenge you must analyze demographic data using Pandas. You are given a dataset of demographic data that was extracted from the 1994 Census database. Here is a sample of what the data looks like:
You must use Pandas to answer the following questions:
- How many people of each race are represented in this dataset? This should be a Pandas series with race names as the index labels. (race column)
- What is the average age of men?
- What is the percentage of people who have a Bachelor's degree?
- What percentage of people with advanced education (Bachelors, Masters, or Doctorate) make more than 50K?
- What percentage of people without advanced education make more than 50K?
- What is the minimum number of hours a person works per week?
- What percentage of the people who work the minimum number of hours per week have a salary of more than 50K?
- What country has the highest percentage of people that earn >50K and what is that percentage?
- Identify the most popular occupation for those who earn >50K in India.