Repository navigation
Reports
kanit report turns a launch's records into answers: what each attempt used, what limited the launch, what each step should request, how two launches differ, and what produced the results, for a methods section. Every report reads .workz/ only, so you can run it during a launch, after it, or on a launch from last week. The examples on this page come from one demo launch: six samples through qc, trim, align and count, then a report, 25 rules on a budget of 6 threads and 6 GiB, with a 600 MiB shared index. Where a line is wider than the page, the text before it says what was cut. Every rule declares its step, sample, category and tool (Concepts).
Reports look at a launch in two scopes:
- The pipeline: the latest completed run of every rule, whether this launch ran it or reused it from an earlier launch. Steps, time per category, tool and sample, request suggestions and comparisons use it, so a launch that reran one script still describes the whole pipeline.
-
The launch: the attempts this launch started. The attempt table, the critical path, waiting for resources and the use of the budget use it. An attempt writes its record when it ends, so while the launch runs, its running attempts are left out, and
reportsays so on standard error; the HTML page shows them.
The reports use these terms:
- Attempt: one run of a rule's command. A rule that is retried makes several in one launch.
-
Waiting once ready: the time from a rule's last producer ending to its start, by what it waited for:
threads,memory,jobs, a group,loading shared:NAME, orstartingfor the engine's own time after the budget had room. - Held: on the critical path, the time a rule waited after the rule before it on the path ended, for its other producers.
- Rule-seconds: seconds added up over rules, so ten rules waiting for 3 s make 30 rule-seconds; divided by the elapsed time, the number of rules waiting on average.
- Bound: a time the launch could not be shorter than, given the work its attempts did, such as its critical path or its reserved thread-seconds over the thread budget.
- CPU use: CPU time over the thread-seconds reserved: 100% kept every requested thread busy.
- Idle: an attempt that ran for half a second or more on almost none of its request, waiting or handing its work to a process outside its cgroup; its counters size nothing.
- Run sample: what the engine records every 5 s while a launch runs: the threads and memory reserved, and the CPU and memory in use.
kanit report prints one row per attempt of the newest launch, or of --launch ID, as TSV; here four of its rows and 9 of its 24 columns, aligned:
rule      attempt  status     wall_s  cpu_s   memory_mib  peak_mib  waited_s  wait_reason
align_S1  1        completed  16.991  46.797  1500        402.7     16.083    threads
align_S2  1        completed  20.005  56.148  1500        403.1     0.181     loading shared:genome
trim_S4   1        failed     0.002   0.002   512         1.0       10.031    threads
trim_S4   2        completed  3.013   2.991   512         1.7       8.022     threads
| Column | Unit | Meaning |
|---|---|---|
wall_s, cpu_s
|
seconds | elapsed and CPU time of the attempt |
cpu_efficiency |
ratio | CPU time over wall time times threads |
threads |
threads | request |
memory_mib |
MiB | request |
peak_mib |
MiB | cgroup peak, page cache included |
max_rss_mib |
MiB | largest resident set of one process |
peak_per_request |
ratio |
peak_mib over memory_mib
|
oom_kills |
count | out-of-memory kills in the cgroup |
limit_events |
count | times the cgroup reached its limit |
waited_s |
seconds | ready but not started |
wait_reason |
text | what it waited for longest |
cpu_stall |
ratio | share of wall time stalled on CPU |
memory_stall |
ratio | share of wall time stalled on memory |
io_stall |
ratio | share of wall time stalled on I/O |
idle |
boolean | used almost none of its request |
reason |
text | why the attempt failed, or -
|
step, sample
|
text | the rule's step and sample, or -
|
category, tool
|
text | the rule's category and tool, or -
|
- Stalls come from the kernel's pressure counters for the attempt's cgroup: the share of time some of its processes waited for CPU, memory or I/O.
- Times have three decimals, in seconds; ratios four; memory one, in MiB.
--format jsonkeeps full precision. - A missing number is
NA, which R and pandas read as missing; a missing text is-. For launches run with--no-isolation,peak_mib,peak_per_requestand the stall columns areNA, andoom_killsandlimit_eventsare 0. -
--format jsonprints the same attempts as a JSON array with the same field names, numbers unrounded andnullfor no value, and two more fields:started_ns, the start in nanoseconds since the Unix epoch, anddirectory, the attempt's record directory. -
-o FILEwrites any report to a file instead of standard output.
kanit report --bottlenecks reads the same records and the event stream and explains where the time went (each step's character cut after its first clause):
launch 20261107T060905.136-0b96682a: 1m 13s elapsed; 26 attempts in this launch, 386 thread-seconds reserved
the thread budget limited this launch: it took 1m 13s, 14% more than its rules' thread requests need at that limit

what limited the launch (the attempts it made could not take less than any of these)
    critical path                   29.1 s  4 rules in a chain of work
  > threads                         1m 04s  5.3 of 6 threads reserved on average
    CPU time                        56.4 s  4.6 of 6 cores busy on average
    memory                          34.7 s  2.8 GiB of 6.0 GiB reserved on average
    group disk                      21.0 s  0.6 of 2 units held on average
    engine                           80 ms  the engine's own CPU time: checks, scheduling and records

critical path (the longest chain of work in this launch, and when each rule waited once ready)
  at   10.0 s  trim_S5                                  ran    5.0 s, waited   10.0 s
  at   37.2 s  align_S5                                 ran   20.0 s, waited   22.2 s
  at   59.3 s  count_S5                                 ran    2.0 s, waited    2.0 s
  at   1m 11s  report                                   ran    2.0 s, waited     0 ms, held 9.8 s for producers off the path
  4 rules: 29.1 s of work, 34.2 s waiting once ready, 9.8 s held for producers off the path

waiting for resources (ready rules that waited, on average over the launch, and their rule-seconds)
  threads                             3.6 rules     4m 26s
  group:disk                          0.4 rules     30.2 s
  loading shared:genome              <0.1 rules      0.2 s
  starting                           <0.1 rules      56 ms
  starting: the budget had room; the engine was recording ended attempts and starting other rules

resource groups (while their rules waited)
  disk                              30.2 s waited; no run samples while they waited

steps (the latest completed run of every rule)
  STEP    RUNS     MEDIAN  CPU USE  THREADS    REQUEST       USED       PEAK    SUGGEST  CHARACTER
  qc         6      3.0 s      99%        1    256 MiB  <=4.0 MiB    1.9 MiB     64 MiB  CPU-bound; ...
  trim       6      4.0 s      50%        2    512 MiB  <=3.9 MiB    1.7 MiB     64 MiB  runs fewer threads; ...
  align      6     17.0 s      92%        3    1.5 GiB    403 MiB    403 MiB    512 MiB  CPU-bound; ...
  count      6      2.0 s     100%        1    256 MiB  <=3.9 MiB    1.6 MiB     64 MiB  CPU-bound; ...
  report     1      2.0 s     100%        1    256 MiB  <=3.9 MiB    1.9 MiB     64 MiB  CPU-bound; ...
  USED: the largest resident memory of one process, or the cgroup peak for rules with shared inputs or containers
  PEAK: the memory charged to the rule's cgroup, page cache included; libraries already in memory count in USED only
  <=: at most this; a process started from the engine counts the engine's memory, which was larger

time per category (the latest run of every rule)
  CATEGORY        STEPS  RUNS       WALL        CPU  CPU SHARE
  alignment           1     6     1m 42s     4m 43s        84%
  trimming            1     6     24.0 s     23.9 s         7%
  qc                  1     6     18.0 s     17.9 s         5%
  quantification      1     6     12.0 s     12.0 s         4%
  report              1     1      2.0 s      2.0 s         1%

time per tool (the latest run of every rule)
  TOOL           STEPS  RUNS       WALL        CPU  CPU SHARE
  bowtie2            1     6     1m 42s     4m 43s        84%
  fastp              1     6     24.0 s     23.9 s         7%
  fastqc             1     6     18.0 s     17.9 s         5%
  featureCounts      1     6     12.0 s     12.0 s         4%
  multiqc            1     1      2.0 s      2.0 s         1%

samples (the latest run of every rule), most CPU time first
  SAMPLE  STEPS  RUNS       WALL        CPU  SLOWEST STEP
  S5          4     4     30.0 s     1m 06s  align 20.0 s
  S2          4     4     28.0 s     1m 04s  align 20.0 s
  S1          4     4     27.0 s     56.8 s  align 17.0 s
  S4          4     4     25.0 s     55.1 s  align 16.9 s
  S3          4     4     24.0 s     48.2 s  align 14.0 s
  S6          4     4     22.0 s     46.3 s  align 14.0 s

shared inputs
  NAME    TYPE     STARTS  USERS       LOAD       HELD     MEMORY       PEAK    SUGGEST
  genome  mapped        1      6      0.2 s     1m 06s    600 MiB    602 MiB          -

use of the budget while rules ran (run samples every 5 s)
  threads reserved 5.4 of 6 on average; CPU cores in use 4.8 on average
  memory reserved 2.9 GiB of 6.0 GiB on average; the run's memory in use, page cache included, peaked at 1015 MiB
Read it from the top:
-
What limited the launch. Lower bounds on the elapsed time of the attempts the launch made, failed ones included. The launch could not be shorter than:
- its critical path, the longest chain of work through the graph;
- the work a limit of the budget carried divided by that limit, such as reserved thread-seconds over the thread budget, with memory counting shared inputs while they are held;
- the CPU time its rules used over the threads;
- the engine's own CPU time, as the engine works on one thread.
The use column says how full each limit was on average.
>marks the largest bound, and the line under the launch line says how far the launch ran over it; under the thread budget it also says how much of the reserved threads the rules kept busy, and which step left the most of its threads unused. A launch shorter than 2 s is not judged: starting and recording rules weigh too much in it. The bounds describe the measured attempts under their recorded requests. They suggest where to investigate, but do not prove that a larger budget or a different order will shorten the run. Time above the bounds can also include startup, shared-input loading, recording, retries and runtime delays. -
Critical path. The longest chain using the launch's measured attempt durations, including retries. It can differ from the chain the scheduler estimated from earlier runs.
atis when a rule first started,waitedhow long it was ready before it started, andheldhow long it waited, after the rule before it on the path ended, for producers off the path; a rule retried after a pause shows the time between its attempts. The summary adds recorded checks and the remaining time after the path ends. Recorded launch time starts after loading the workflow and acquiring the lock, so it excludes earlier systemd setup and parsing. Measure the whole command to compare total invocation time. -
Waiting for resources. How many ready rules waited for each resource, on average over the launch, and the rule-seconds they waited added up, which can exceed the elapsed time.
-
Resource groups. For each group that held rules back, the share of the run samples, taken every 5 s while some rule waited for the group, in which the free threads and memory had room for one of the waiting rules; each sample counts once. With fewer than three samples it says they are too few to judge. From 25%, the report says a higher
maxwould have started them earlier; below that, it says the budget was full and a highermaxwould not help much. Here the waits fordiskheld only one sample, too few to judge. -
Steps. Each step in the order of the workflow's graph: its runs, median wall time, CPU use (CPU time over wall time times threads, at most 100%), thread and memory request, memory used, cgroup peak, suggested memory request and character.
USEDis what the suggestion sizes. AUSEDmarked<=is at most that much: a process started from the engine counts the engine's memory, and the command's own was smaller.PEAKcan be smaller thanUSEDfor small commands: shared libraries already in memory count in a process's resident memory but are charged to the cgroup that loaded them. Notes after the character flag out-of-memory kills, a request more than twice the suggestion and at least 256 MiB above it, a step that reached its limit through page cache without being killed, and a step that uses under half the threads it reserves, or one that kept all of them busy. -
Time per category and per tool. The steps, runs, wall time and CPU time of each category and each tool, most CPU time first, with its share of all CPU time. Here alignment took 84% of it: a faster aligner would save the most.
-
Samples. Each sample's steps, runs, wall time and CPU time, most CPU time first, and the step it spent longest in. When that step took at least 1.5 times its median and 2 s more, the line says how many times the median: that sample is the one to look at. Here S5 and S2 aligned for 20.0 s against a median of 17.0 s, which is not enough to be marked.
-
Shared inputs. Each shared input's type, starts, the rules that used it, load time, time held from loading to release, declared memory and peak. Services get a suggested
memory(Sizing a service). -
Use of the budget. The average threads and memory reserved, the CPU cores in use, and the run's peak memory in use, from the samples taken every 5 s while rules run.
The character names what a step spent its time on, judged from its stall shares and its CPU use, its CPU time over the thread-seconds its runs reserved. The first that applies:
-
memory-throttled: stalled on memory at least 20% of the time. -
I/O-bound: stalled on I/O at least 30% of the time. -
CPU-starved: waiting for CPU at least 30% of the time, usually with more threads than its quota. -
CPU-bound: CPU use at least 70%. -
runs fewer threads: busy on at least 0.7 cores but under 60% of the two or more threads it reserved. -
mostly idle: CPU use under 30%. -
mixed: anything else.
Without stall data, in launches run with --no-isolation, mostly idle and mixed read -, as stalls alone tell waiting from work. Runs adding up to less than a second show - for CPU use and character: too little to judge.
An attempt that completed after at least half a second while using under a tenth of its CPU request, and less memory than a twentieth of its request or 64 MiB, whichever is larger, is counted as idle: its command waited (a sleep, the network, a lock) or handed the work to a process outside its cgroup, such as a systemd service. Either way its counters size nothing. A note counts the idle attempts, and when most runs of a step are idle, the steps section shows no memory for it and gives no sizing advice.
kanit report --suggest prints the suggested request for each step: on a terminal as a table with units, and to a file or a pipe as this TSV, for a workflow generator to apply (here 9 of its 12 columns, aligned):
step    runs  threads  threads_used  suggest_threads  memory_mib  used_mib  used_basis    suggest_mib
qc      6     1        1.00          1                256         4         engine_bound  64
trim    6     2        1.00          1                512         4         engine_bound  64
align   6     3        2.81          3                1500        403       cgroup        512
count   6     1        1.00          1                256         4         engine_bound  64
report  1     1        1.00          1                256         4         engine_bound  64
-
runscounts the step's rules with a completed run, the latest of each. A suggestion from one or two runs covers only the inputs those runs had; the HTML page says how many runs it rests on. -
threads_usedis the largest CPU time over wall time of any run.suggest_threadsrounds it up, ignoring a surplus under 0.05, and never exceeds the current request. -
used_mibis the largest memory any run used, asused_basissays:processis the largest resident memory of one process;engine_boundis that figure when it is no larger than the engine's own memory, which a process started from the engine counts, so the command used at most that much;cgroupis the cgroup peak, for rules that use shared inputs or containers, whose work the processes' resident memory misses, or the anonymous memory sampled in the cgroup when several processes at once held more than the largest of them. -
peak_mibis the largest cgroup peak, page cache included. -
suggest_mibisused_mibplus 20%, rounded up to a multiple of 64 MiB, and at least 64 MiB. -
noteismeasured;out_of_memorywhen an attempt was killed for exceeding its memory, and the suggestion is then at least half again the request it exceeded; oridlewhen most runs were idle, and the suggestion keeps the current request. -
at_thread_limitistruewhen the runs kept nine tenths or more of their threads busy over their time: the request capped them, sosuggest_threadscannot be more than the request, and the program may use more threads if given them. The steps section notes it after the character. -
--format jsonprints the same as a JSON array.
Here trim reserves 2 threads and 512 MiB but used 1 thread and 4 MiB, and align reserves 1500 MiB for 403 MiB used. Applying the suggestions lets more rules run at once on the same budget. Suggestions come from what the measured inputs needed; size for the largest input you expect, not the smallest you measured.
kanit report --compare OTHER compares the newest launch, or --launch ID, with another one, named by launch ID, by launch directory, or by a working directory for its newest launch. Here the demo ran again with --rerun on 8 threads instead of 6 (paths shortened):
baseline .../.workz/launches/20261107T060905.136-0b96682a
launch   .../.workz/launches/20261107T061157.192-d1b5ca16
budget   6 threads, 6.0 GiB, 6 jobs against 8 threads, 6.0 GiB, 8 jobs
note: the budgets differ, so the elapsed time compares the budgets as well as the work

                            BASELINE     LAUNCH   CHANGE
  elapsed s                     73.1       60.1    -18%  budgets differ
  attempts                        26         25
  thread-seconds reserved        386        386      0%

per step (latest run of every rule)
                WALL S, MEDIAN            PEAK MiB, LARGEST           CPU S, TOTAL
  STEP    RUNS  BASELINE  LAUNCH CHANGE  BASELINE  LAUNCH CHANGE  BASELINE  LAUNCH CHANGE
  qc         6      3.00    3.00      0%         2       2       -      17.9    17.9      0%
  trim       6      4.01    4.00      0%         2       2       -      23.9    23.9      0%  wall time within its runs' spread
  align      6     16.97   16.99      0%       403     404      0%     282.7   283.3      0%  wall time within its runs' spread
  count      6      2.00    2.00      0%         2       1       -      12.0    12.0      0%  wall time within its runs' spread
  report     1      2.00    2.00      0%         2       2       -       2.0     2.0      0%
- The lines above the table give both budgets; notes say when the budgets, the workflow file or the engine differ, as the elapsed time then compares those too.
- Each step compares the median wall time of its runs, the largest cgroup peak and the total CPU time: the baseline's value, the launch's and the change.
- A change is left out where either value is too small to compare: under 0.1 s of wall or CPU time, under 8 MiB of memory.
- A step with three or more runs on a side whose median moved less than its runs differ among themselves (half their range over the median) says its wall time is within its runs' spread: one launch on each side cannot show such a change.
- A step whose runs were mostly idle in either launch shows
-for its memory and CPU changes and says in which launch. - A step with no completed run on one side shows
-for that side and says which. - A step reused in the launch compares the run it reused, and says so.
Here two more threads saved 18% of the elapsed time while every step ran as before: the gain came from the larger budget. The bottleneck report of the second launch shows why no more was gained: the thread budget still limits it, and waiting for group:disk grew from 30.2 s to 42.2 s.
kanit report --methods describes what produced the results in the working directory, for the methods section of a paper or a lab notebook. It reads state.json and the records of the attempts it points to, so it covers every recorded rule, whichever launch ran it, including a rule since removed from the workflow whose record remains. A small workflow whose join step was rerun in a second launch:
Results in .../methods: 3 rules, finished from 2026-11-07T06:09:35.603Z to 2026-11-07T06:09:35.639Z

workflow
  methods 2.1, file sha256:fa26c0dbdbdc30630c5c4568700781e8846cb512cf5001f0ab01cae77d6302f0
engine
  kanit 0.7.0 sha256:354e59f1b3f4282be083232c11faa0ce99e420e75f44741f6076c87a919eacda
launches
  20261107T060935.595-2f3ad294 (2 rules)
  20261107T060935.630-4aa809c8 (1 rule)

tools
  upper: upper 1.4.2
    host
    version  echo upper 1.4.2
    steps    up (2 rules)
  (no tool label)
    host
    steps    join (1 rule)

steps
  up: 2 rules, 1 thread and 64 MiB each
    up_s1: echo one > s1.txt
  join: 1 rule, 1 thread and 64 MiB
    join: cat s1.txt s2.txt > all.txt
-
workflow, engine and launches list each workflow file (its
[workflow]name and version, and the digest of its bytes), engine and launch that made the results, with their rules when there are several. -
tools groups rules by their
toollabel, image and version command. A container rule's tool names its image reference and the image ID it ran; a host rule's sayshost. The version is the first line its rule'sversioncommand printed when it exited 0 (Writing workflows);(no version recorded)follows a command that failed, did not run, or ran in a launch since removed. -
steps lists each step in the order its rules first finished, with its requests and the command of its first rule by name;
request not recordedmarks a step whose attempt records are gone. -
--format jsongives the same as one JSON object, and-o FILEwrites it to a file.
kanit report --format html -o report.html writes the launch as one self-contained page, with no scripts and nothing loaded from elsewhere, to open in a browser or attach to a message. The page is drawn as an engineering sheet, ink on grid paper in light and a charcoal sheet in dark. It follows the reader's color scheme until the theme tag at its corner picks auto, light or dark, and it always prints in light.
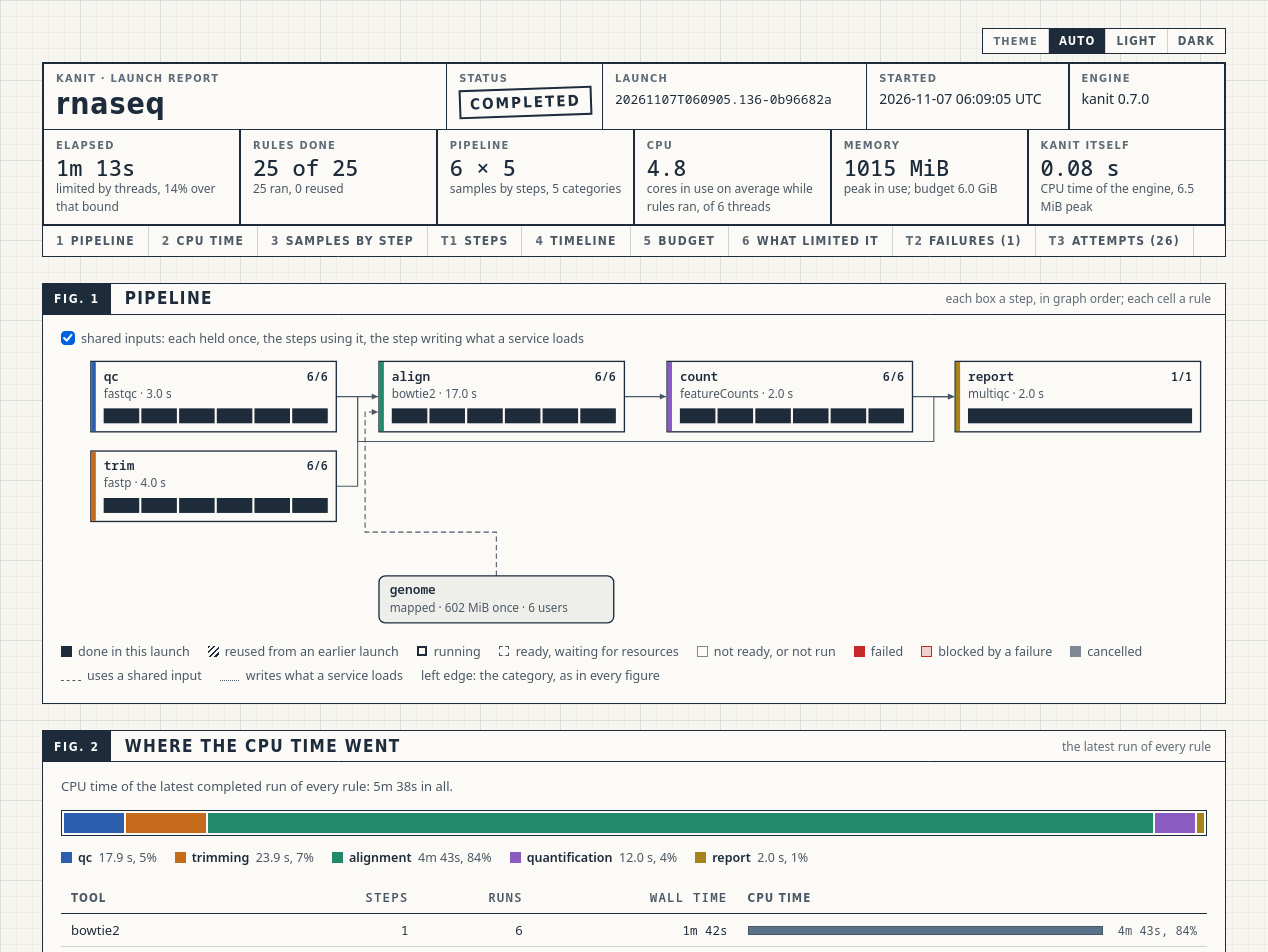
The sheet holds, in order:
- Title block. The launch's name, status, ID, start time and engine, with, under the status of a launch that did not complete, the reason it was refused or stopped or its first failure; the elapsed time and what limited it; the rules done, ran and reused; the pipeline's samples by steps; the CPU cores in use and peak memory against the budget; and the engine's own CPU time and memory. A launch error follows it.
- FIG. 1, Pipeline. A box for each step, in columns by graph depth, wired at right angles to the steps it reads from. Each box gives the step's tool, median wall time and rules done, and a cell for each rule in its state: done, reused, running, waiting for resources, not run, failed, blocked or cancelled. Hovering a cell names the rule. Below the steps, each shared input is a box with the memory it holds once and its users: a dashed wire runs into each step that maps or joins it, and a dotted wire from the step writing what a service loads. A checkbox above the figure hides that layer; print shows it.
- FIG. 2, Where the CPU time went. The CPU time as one bar split by category, or by step when no rule declares a category, then per tool.
-
FIG. 3, Samples by step, when rules have samples. A row per sample and a column per step in pipeline order, with each sample's CPU time. Each cell is shaded by the run's wall time against the median of its step, so a dark cell is a slow sample in any column.
!marks a run at least 1.5 times its median and 2 s longer,xa failed rule and/a blocked one. Rules without a sample share the last row. - TABLE 1, Steps. Each step with its category, tool and samples, its runs and median wall time, the spread of its wall times, the cores it used of the threads it requested, the memory it used and the page cache in its peak against its request, and the suggested request.
- FIG. 4, Timeline. One labelled row per attempt: the wait for resources as a thin bar, then the run in the color of its category, or red if it failed, with the critical path outlined. A dimension line gives the elapsed time.
- FIG. 5, Use of the budget. Threads reserved against CPU cores in use, and memory reserved against memory in use, over the launch, with the budget as a dashed line; the memory that shared inputs hold, once, is its own band at the bottom of the reserved memory.
- FIG. 6, What limited the launch. The bounds on the elapsed time against it, with the largest marked and a sentence on what limited the launch; the critical path rule by rule, with when each was held for producers off the path, waited for resources and ran; the ready rules that waited for each resource; and the resource groups.
- TABLE 2, Failures. Every failed or cancelled attempt with the last 40 lines of its standard error, marked when a later attempt completed.
- TABLE 3, Attempts. Every attempt with its step and sample, which scrolls under a fixed header.
Figures 1 to 3 and Table 1 cover the pipeline, so a launch that reused rules still shows every sample and step, with each reused rule hatched; the rest cover the launch itself. Each category, or each step when no rule declares a category, keeps one color across the sheet, on the left edge of its pipeline box, its timeline bars and its matrix column. Up to eight get a color each, in pipeline order; with more, the first seven keep theirs and the rest share gray as "other". Hovering a cell, dot or bar gives its numbers.
Every launch also keeps this page as report.html in its launch directory: run draws it as the launch starts, at least 15 s between drawings while it runs, and once more at the end (Running workflows). On a large launch it waits at least twenty times the preceding draw's duration. While the launch runs, the page reloads itself every 15 s; the final page stops reloading. kanit report --format html draws the same page on demand, for any launch. Reload manually for an earlier update, or use kanit watch for faster progress. A theme picked on a page that reloads itself lasts only while the browser keeps the page's form state; the reader's color scheme is the lasting choice.
Running cells and bars are marked by steady outlines, without animation, and printing the page includes every figure. The CPU and memory charts draw every five-second run sample.
For a small runnable demonstration, use examples/report-tour/ in the repository. Its three rules produce completed, reused and failed-launch pages; optional live mode adds two six-second waits so the resource charts have samples. The tour's README explains the figures, limits and output files.