Repository navigation
Watching a Launch
While a launch runs, and after it ends, three commands show it: watch for the live view, status for its summary, and logs for a rule's output. They read the records in .workz/ from a separate process. Reading and drawing still use CPU, memory and I/O shared with the launch.
Run kanit watch in the working directory, or kanit watch path/to/workflow.toml from elsewhere, while kanit run works in another terminal:
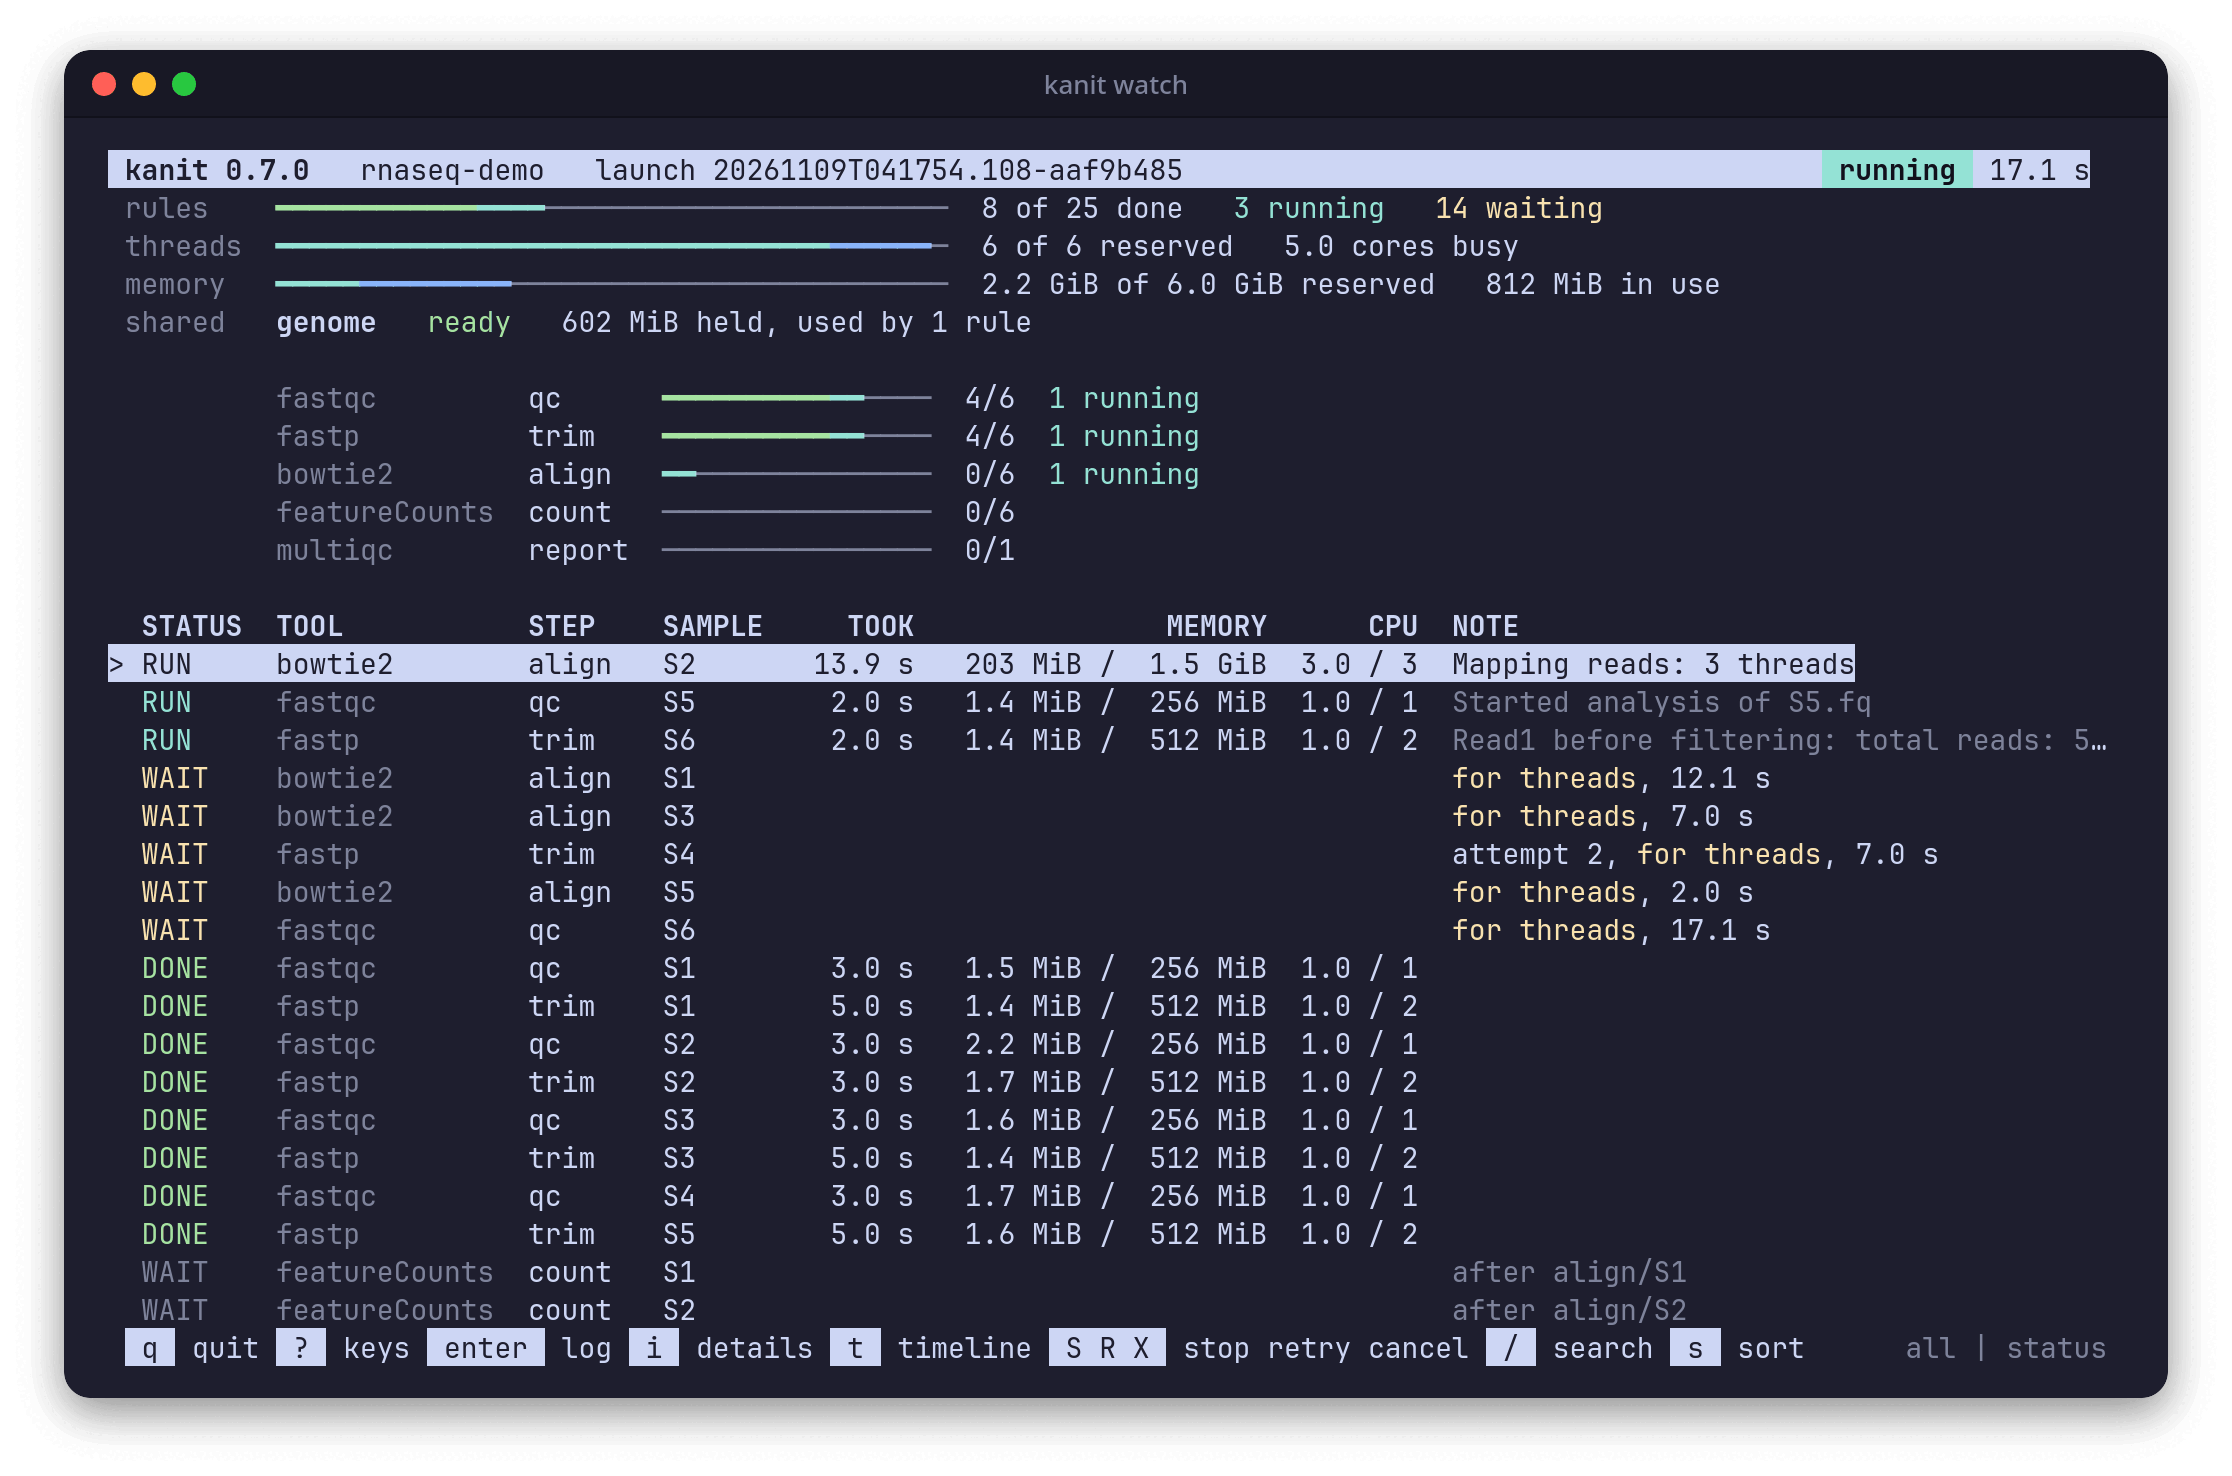
The view uses the run log's columns, status tags, units and marks (Running workflows), so a rule reads the same in both. At the top, a title line names the engine, the workflow, the launch, its state and how long it has run, and gauges show its use of the budget:
- rules: a bar of the selected rules, done in green, running in cyan and failed, blocked or stopped in red, with how many are done, running, waiting, failed, blocked and stopped.
- threads: the threads reserved against the budget, and the CPU cores the run keeps busy.
- memory: the memory reserved against the budget, and the memory the run uses.
- shared: one line for each shared input, with its state, the memory it holds, and how many rules have used it.
Below them, the table of the steps that the run log's footer draws: each step's tool, a bar, how many of its rules are done, and how many failed, run, are blocked or stopped. On a short terminal the steps that are done fold into one row.
Then a table of every selected rule, running rules first, then waiting, failed, done and waiting-for-producer ones:
-
STATUS: a tag,
RUN,WAIT,RETRY,DONE,REUSE,FAIL,BLOCKorSTOP.WAITcovers a rule waiting for room in the budget and one waiting for its producers; its note says which. -
TOOL, STEP and SAMPLE: the rule's names, as wide as the launch needs; a terminal too narrow for them cuts them with
…. - TOOK: how long the rule has run, or ran.
-
MEMORY: for a running rule, the memory its cgroup uses now against its request, such as
203 MiB / 1.5 GiB; for a finished rule, its recorded peak. -
CPU: the cores the attempt uses against its threads, such as
2.9 / 3; for a finished rule, the average over its run. -
NOTE: the last line a running attempt wrote to standard error, or to standard output if it wrote nothing to standard error; what a waiting rule waits for (
for threads, 4.0 s,after align/S2); the reason a rule failed; the failure that blocked a rule (after align/S4 failed); the attempt of a rule tried more than once.
A terminal too narrow for MEMORY and CPU leaves them out, as the run log does. The selection stays on the top row until you move it, so the busiest rule stays selected as rules finish. The view stays open after the launch ends, so you can look through it; q leaves. A view started before its launch wrote its records picks up the launch's names as soon as they are written.
Tip
Set NO_COLOR=1, or use a terminal with TERM=dumb, for a view without colors; outside a UTF-8 locale the bars are drawn with # and -.
? shows every key in the view itself.
- j and k, or the up and down arrows, move the selection; Space and b, or PgDn and PgUp, move it a page; g and G, or Home and End, jump to the first and last rule.
- Enter, l or the right arrow follows the selected attempt's standard error as it grows, with lines that mention an error in red and a warning in yellow; o switches to standard output.
-
i shows the selected rule in detail: its request, the rules it reads from (
after) and that read from it (before), the shared inputs it holds, when it became ready and started, gauges of its CPU and memory against the request, how often it reached its memory limit, its stall times, and its last lines of output. - t draws a timeline of the launch.
- a shows all rules, r running and retrying ones, w waiting ones, f failed, blocked and stopped ones, and d done ones.
- / searches rule names; Enter keeps the search and Esc clears it.
- s cycles the order: status, elapsed time, peak memory, name.
-
S stops the selected rule and R retries it, as
kanit controldoes. X cancels the launch when pressed a second time within 3 s. - q or Esc goes back, or leaves from the table; h or the left arrow goes back to the table; Ctrl+C leaves.
t draws every rule on one time axis, with ticks such as 30s, 1m and 1m30s. A dotted stretch is the time a rule waited to start; then a bar shows its run, green when it completed, cyan while it runs, red where it failed and magenta where it was stopped. Without colors the bar is drawn with =, >, ! and x.

Here the qc and trim rules, which need one or two threads, run first. Each align rule, with priority = 10, starts before any other ready rule once three threads are free, so the alignments wait for threads while smaller rules fill the gaps. The critical path ran through trim/S5, align/S5 and count/S5 to report.
When its output is not a terminal, watch prints the same view as text, without the keys, at every refresh until the launch ends; --once prints it once:
 kanit 0.9.0   rnaseq-demo   launch 20261109T041754.108-aaf9b485                                       running  18.0 s
 rules    ━━━━━━━━━━━━────────────────────────────  8 of 25 done   3 running   14 waiting
 threads  ━━━━━━━━━━━━━━━━━━━━━━━━━━━━━━━━━───────  6 of 6 reserved   5.0 cores busy
 memory   ━━━━━───────────────────────────────────  2.2 GiB of 6.0 GiB reserved   812 MiB in use
 shared   genome   ready   602 MiB held, used by 1 rule

          fastqc         qc      ━━━━━━━━━━──────  4/6  1 running
          fastp          trim    ━━━━━━━━━━──────  4/6  1 running
          bowtie2        align   ────────────────  0/6  1 running
          featureCounts  count   ────────────────  0/6
          multiqc        report  ────────────────  0/1

  STATUS  TOOL           STEP    SAMPLE     TOOK               MEMORY      CPU  NOTE
  RUN     bowtie2        align   S2       14.8 s   203 MiB /  1.5 GiB    - / 3  Mapping reads: 3 threads
  RUN     fastqc         qc      S5        2.9 s   1.4 MiB /  256 MiB    - / 1  Started analysis of S5.fq
  RUN     fastp          trim    S6        3.0 s   1.4 MiB /  512 MiB    - / 2  Read1 before filtering: total reads: 5…
  WAIT    bowtie2        align   S1                                             for threads, 13.0 s
  WAIT    bowtie2        align   S3                                             for threads, 8.0 s
  WAIT    fastp          trim    S4                                             attempt 2, for threads, 8.0 s
  WAIT    bowtie2        align   S5                                             for threads, 3.0 s
  WAIT    fastqc         qc      S6                                             for threads, 18.0 s
  DONE    fastqc         qc      S1        3.0 s   1.5 MiB /  256 MiB  1.0 / 1
  DONE    fastp          trim    S1        5.0 s   1.4 MiB /  512 MiB  1.0 / 2
  DONE    fastqc         qc      S2        3.0 s   2.2 MiB /  256 MiB  1.0 / 1
  DONE    fastp          trim    S2        3.0 s   1.7 MiB /  512 MiB  1.0 / 2
  DONE    fastqc         qc      S3        3.0 s   1.6 MiB /  256 MiB  1.0 / 1
  DONE    fastp          trim    S3        5.0 s   1.4 MiB /  512 MiB  1.0 / 2
  DONE    fastqc         qc      S4        3.0 s   1.7 MiB /  256 MiB  1.0 / 1
  DONE    fastp          trim    S5        5.0 s   1.6 MiB /  512 MiB  1.0 / 2
  WAIT    featureCounts  count   S1                                             after align/S1
  WAIT    featureCounts  count   S2                                             after align/S2
  WAIT    featureCounts  count   S3                                             after align/S3
  WAIT    bowtie2        align   S4                                             after trim/S4
  WAIT    featureCounts  count   S4                                             after align/S4
  WAIT    featureCounts  count   S5                                             after align/S5
  WAIT    bowtie2        align   S6                                             after trim/S6
  WAIT    featureCounts  count   S6                                             after align/S6
  WAIT    multiqc        report                                                 after count/S1
-
--interval MSsets the refresh period (default 1000 ms, at least 100), and--launch IDshows an earlier launch instead of the newest. - If the engine ends without a final summary, the plain repeating view marks the launch unfinished and exits with failure. The interactive view marks it unfinished.
- The tracker reads newly appended events between refreshes; drawing the tables and reading resource counters and log tails still take work.
kanit status prints the summary of the newest launch, or with --launch ID an earlier one's, while it runs or after it ended. On a terminal it is the same report kanit run ends with:
          failed       7 of 10 rules done in 4.3 s: 1 failed, 2 blocked
          samples      trim  align  count  matrix
          S1           ✓     ✓      ✓
          S2           ✓     ✗      ·
          S3           ✓     ✓      ✓
          all                              ·
                       ✓ done   ✗ failed   · blocked or stopped
          failed       align   S2  exited with status 2: STAR: genome index is incomplete: missing SA file
          blocked      count   S2  after align/S2 failed
                       matrix      after align/S2 failed
          slowest      align/S1 2.0 s   trim/S2 1.5 s   trim/S1 1.0 s
          records      .workz/latest/   log launch.log   page report.html
          next         kanit logs align/S2   the output of the failed attempt
                       kanit run             run again; 7 rules are reused
- The first line is the outcome and the count of each status. While the launch runs it reads
running, with the rules running and waiting so far. - A launch of at least two samples shows a matrix of samples by steps:
✓for a rule done (dim when reused),✗failed,·blocked or stopped,~running. Rules without a sample form theallrow. A launch without samples, or with a matrix too wide for the window, lists its steps instead, each with its tool, its counts and its slowest sample. -
failednames each failed rule with its reason, which quotes the last line of its error output;blockednames the rules a failure blocked, with the failure that blocked them. -
slowestnames the three slowest rules that completed;recordssays where the launch's records, text log and page are;nextgives the commands to look further or run again.
The summary is the same text off a terminal, without colors. With --json, status prints the launch's summary.json as written instead; while the launch runs, it prints the summary's fields so far, with "status": "running", so a script can poll one command whatever the launch's state (shortened here):
{"engine":"kanit 0.9.0 sha256:...",...,"status":"running","counts":{"completed":10,...},...}kanit status --history [N] prints one line for each of the last N launches (default 10), newest first:
LAUNCH                         STATUS         ELAPSED  COMPLETED  REUSED  FAILED  BLOCKED  CANCELLED
20261108T095104.564-61a878f4   completed        0.5 s          2       2       0        0          0
20261108T095104.003-b0174746   completed        0.5 s          0       4       0        0          0
20261108T095103.427-974fae85   completed        0.5 s          4       0       0        0          0
Each column counts the launch's rules with that status; CANCELLED also counts the rules it never started. --json prints the same rows as a JSON array. A launch that ended with an error shows it at the end of its line. The newest launch shows running while a run holds the working directory's lock; a launch whose engine ended without recording its end, as when killed, shows unfinished.
kanit logs RULE prints the standard output and error of the rule's newest attempt: in the newest launch that ran the rule, or else the attempt recorded for it. RULE is the rule's name or its step and sample. Each stream opens with a line that names it, the rule, the attempt, how the attempt ended and the stream's size:
kanit logs align/S2stdout align/S2 attempt 1 failed, exit 2 (empty)
stderr align/S2 attempt 1 failed, exit 2 64 B
Mapping reads
STAR: genome index is incomplete: missing SA file
-
kanit logswithout a rule prints every failed attempt of the newest launch, each under its header lines. -
--stderror--stdoutprints one stream; for one rule, without the header line. -
-n Nprints only the last N lines of each stream. -
--attempt Npicks attempt N in the newest launch that ran the rule, and--launch IDlooks in that launch instead. -
--follow(-f) prints the output as it grows until the attempt ends, or its launch stops running.
Every attempt's files stay in its attempt directory, .workz/launches/<ID>/attempts/<rule>/<NNN>/, until you remove the launch (Records).