Skip to content

Using jupyter notebook to read data from csv files to filter, customize and present in charts and pies for visual reading and understanding.

Notifications You must be signed in to change notification settings

alaniwalaa/matplotlib-challenge

Folders and files

NameName
Last commit message
Last commit date

Latest commit


History

14 Commits


Repository files navigation

matplotlib-challenge

Using jupyter notebook to read data from csv files to filter, customize and present in charts and pies for visual reading and understanding

Using Python and related libraries: 1- MatplotLib 2- Scipy 3- Pandas 4- Numpy

and DataFrames

Screen Shot 2021-07-25 at 9.08.38 PMScreen Shot 2021-07-25 at 9 08 38 PM

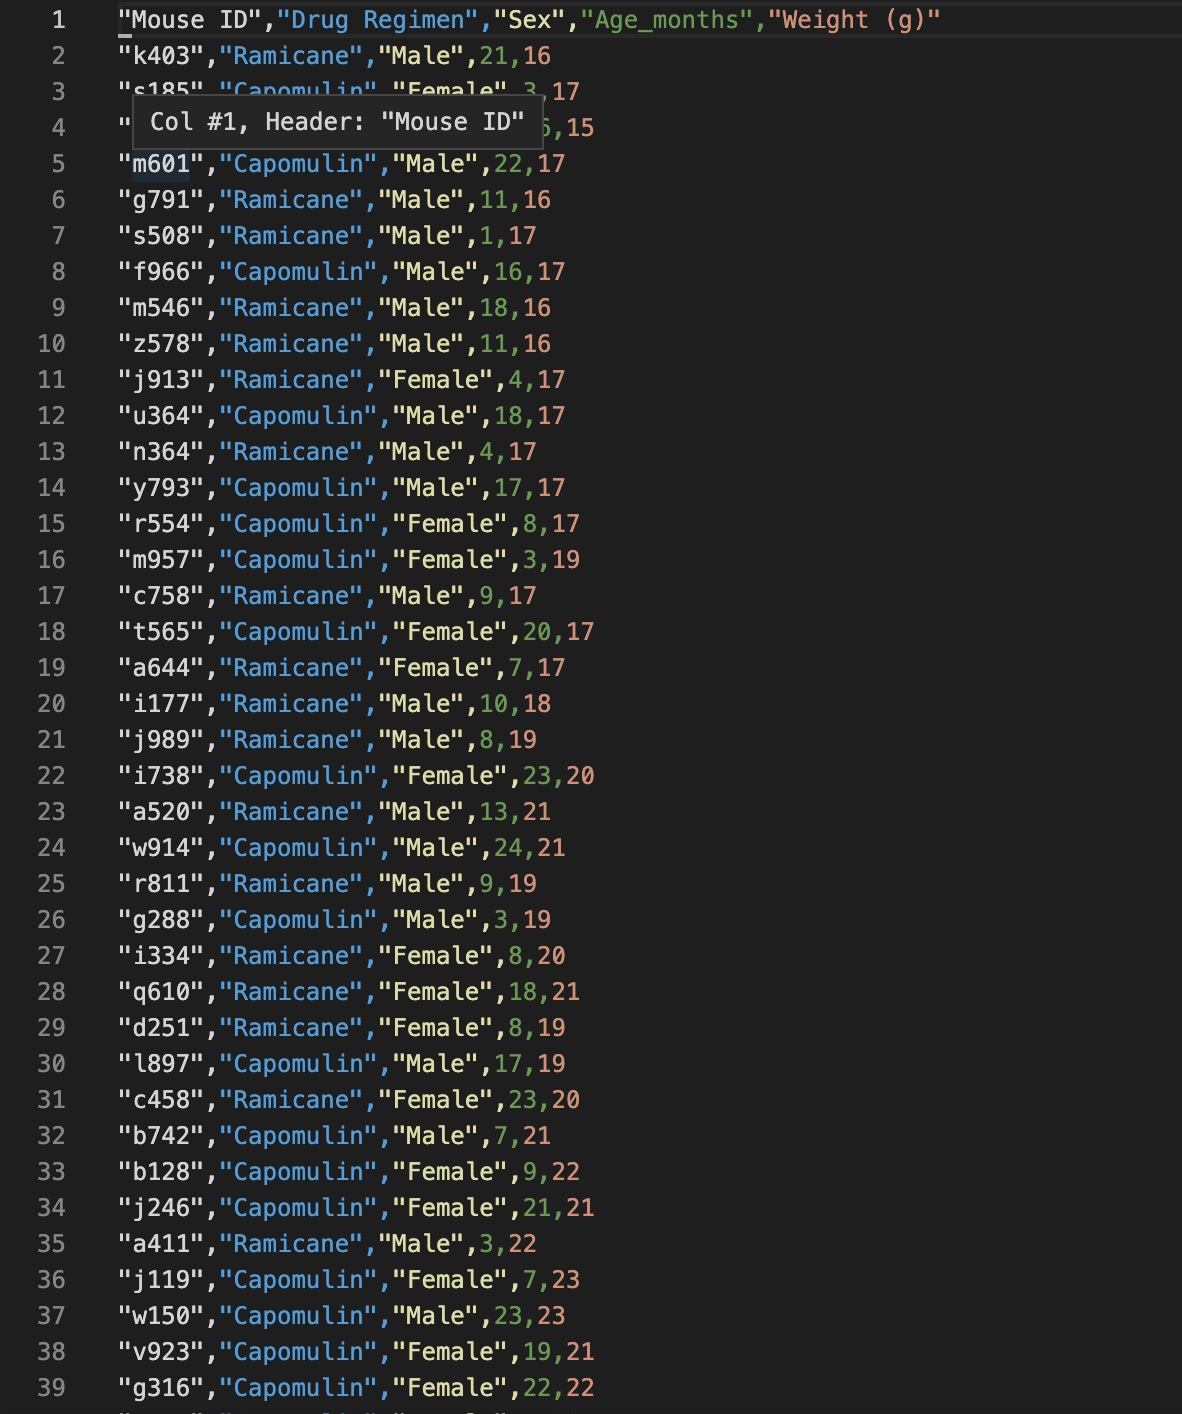
Screen Shot 2021-07-25 at 9.08.55 PMScreen Shot 2021-07-25 at 9 08 55 PM

About

Using jupyter notebook to read data from csv files to filter, customize and present in charts and pies for visual reading and understanding.

Topics

Resources

Stars

Watchers

Forks

Releases

No releases published