This is a POC about angular live edition and generation of nvd3 charts.
Play with it at:
http://atreliz.github.io/angular-nvd3
Use the json object inside the textarea to ediat/add/remove values to the charts.
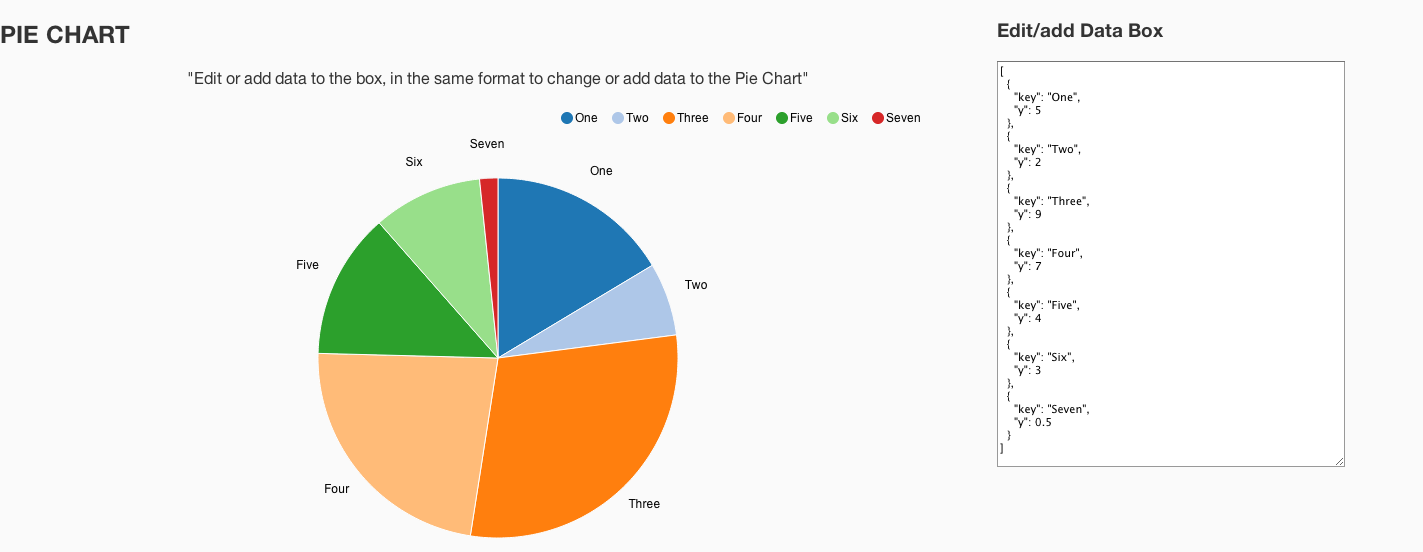
- Example 1: Bar and PIE chart (filter by color)
- Example 2: Scatter chart (filter by color and advance generation)
##Example 1: screenshots

##Example 2: screenshots

