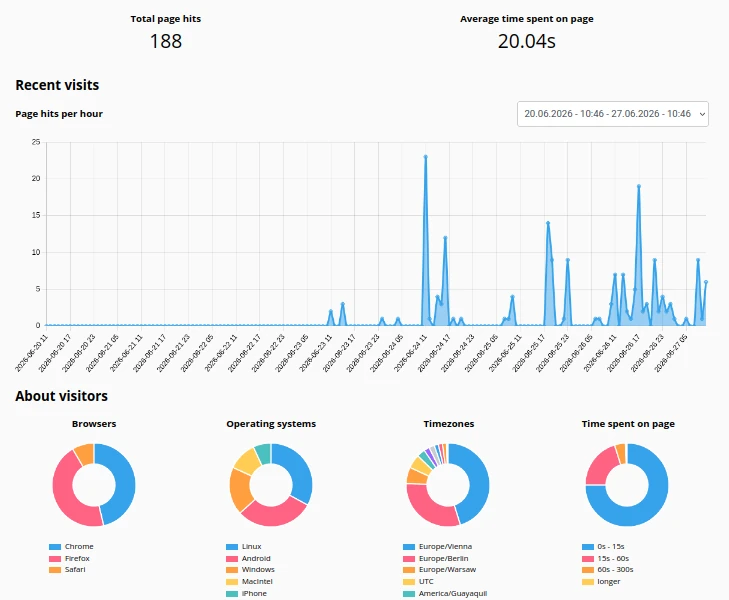
Web analytics made easy. Get nice charts of visits on your site by real humans. Also on Views, Taxonomy Term or Layout pages, not only nodes. Zero configuration required, just install the module and wait for the charts to get populated.
Fully compliant with GDPR, no cookie banner required, as there are no cookies. No tracking, fingerprinting or collection of personal data of any kind. No 3rd party involved at all.
Works fine with page cache turned on and with or without asset aggregation enabled.
Note that only anonymous visits get collected, authenticated users will never show up in those statistics.
Nowadays the vast majority of web traffic is caused by bots and scrapers, but it's the human visitors, that actually matter. Things got harder, since bots started to execute JavaScript. How many humans did actually look at your website? You'll be astonished, how few that are.
Install this module using the official Backdrop CMS instructions
No configuration required, just visit the dashboard on admin/reports/easy-visitor-stats, but a few tweaks are available:
- Tweak the duration to keep data on admin/reports/easy-visitor-stats/settings (the module ships with sane defaults)
- Show charts with animations, if you prefer a little more eye candy
Allow other roles than admin to access the dashboard or raw data by granting permission on admin/config/people/permissions.
Bugs and Feature requests should be reported in the Issue Queue
- Parts of the dashboard aren't very accessible (WCAG), as the interactive charts are images, hard if not impossible to provide useful text alternatives for.
- If a visitor's browser has some script-blocker enabled, those visits won't get counted. Data collection depends on JavaScript.
- Although commonly known bots get filtered out, some might still slip through, if they're in full disguise (don't give any clue that they're bots).
This module's not the only solution for web analytics with Backdrop CMS. There are several, all with their pros and cons.
Easy to use, no external dependencies.
Only for nodes (no Views, Layout pages...), does not seem to filter out bots that execute JavaScript. The reports UI isn't great, just some tables spread over multiple pages.
Also node based (no Views, Layout pages...). Probably counts all bots and scrapers, hard to tell what it looks like, ATM it doesn't work with PHP 8.
Get all the whistles and bells.
Matomo Analytics and Google Analytics
For professionals, but pretty complex to set up. Most sites simply don't need such detailed data, so why collecting in the first place?
Not trivial to comply with GDPR with Matomo, probably impossible with Google Analytics. The latter for sure requires a cookie banner and consent.
Easy to use if already available and set up.
Requires additional software and access to the web logs. Available OOTB with some hosting providers, but requires yet another login to access. And those log based statistics usually aren't great - visually and in terms of relevance.
Interactive charts on the dashboard are build with Chart.js, a simple yet flexible JavaScript charting library for the modern web.
Chart.js is licensed under MIT and maintained on GitHub.
This project is GPLv3 software. See the LICENSE.txt file in this directory for complete text.