Design Patterns
This site contains a list of comic design patterns. Each pattern is described by a name, a description and examples.
The print-out version is here: https://drive.google.com/file/d/0B1zFhCjto4BXU1o2blFtbDBBVm8/view?usp=sharing
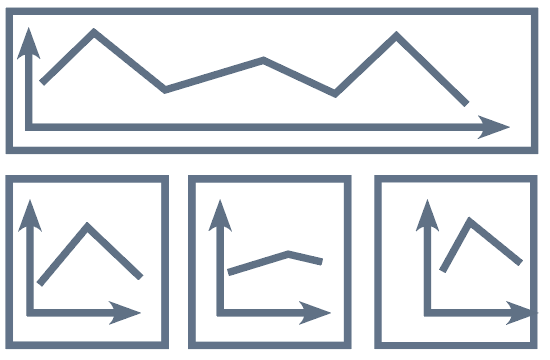
Definition: This pattern starts with a potentially complex and detailed visualization in a single panel (overview panel). Consequent panels (detail panels) will refer to this visualization and explain details important for the story.
Examples: If the visualization is complex, it may require a larger panel and potentially can span an entire page (see Monoframe).
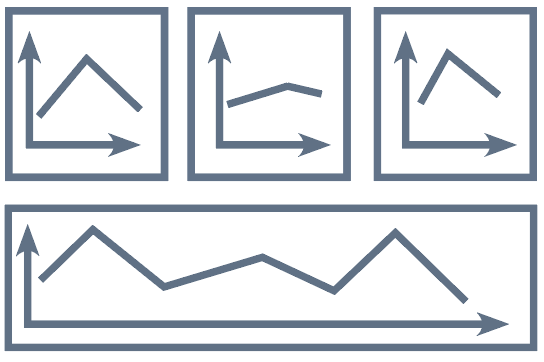
Definition: This pattern consists of a panel that sums up details explained in earlier panels. For example, it can show the entire data set in a single picture while the previous panels have been showing individual facets of the data. This pattern can be seen as the inverse of Overview & Detail. Furthermore, it can provoke new thoughts and offer viewers with space to explore freely. This pattern particularly works when many details or complex relations being depicted previously.

Definition: Start with a question, answer with visualization or eventual resolution. Question & answer could engage an audience and drop a hint of the contents that going to be shown in the comic. Usually, the question is unfamiliar or fallible to the reader, which, stimulates the reader's curiosity and motivate them to discover the facts.
Definition: Build-up visualization piecewise by explaining the visual encoding.Visualization build-up could be applied in versatile occasions. Generally, at the beginning of the comic, it build-up visualization piecewise by guiding the audience to interpret the visual encoding of the inscape,e.g.legend, key dimensions and visual symbols.
Definition: Visualization metaphor explains a visualization metaphor in abstract terms (e.g. time curves, confluent graphs). The metaphor used should be objects or mechanisms in daily life or could easily be understood. As a commonly used expression in comics, metaphor increases interest and reduces the difficulty of comprehension. This is especially appropriate when the target reader may feel hard to get the point of what is being expressed, or need to be explained in lengthy explanation. In addition to being easy to understand, metaphor can also make the content easier to remember.
Definition: Temporal change shows transitions in time by changing the visualization over time. This pattern indicates the “transition from time to time” in traditional comics by taking out key frames from a series of temporal data visualizations.
Definition: Transition highlights the transition between two states of a visualization or narrative pieces to present temporal changes, logical cohesion, a transformation between two data sets or camera movement.
Definition: Continuously zoom into or out of a visualization to disaggregating or aggregating data (e.g. large network). Zoom provides a possibility of showing a transition between overview and detail in limited space.
Definition: Follow-the-hero describes a data-element, following changes over time, explaining different dimensions or relations. An element that runs through the entire work could make the story coherent and give the reader a deep impression. Basically, this element should be introduced at the beginning of a story, and the following story would unfold and develop from it.
Definition: Multiple-explanations is especially for a visualization with multiple key points. Provides several explanations on the same visualization. In this case, data in visualization is not changing, and the same visualization could be placed in several panels but the visualization in each panel can change emphasis. It can be used to introduce different key in one visualisation and to represent the overall relationship between different points.
Definition: Comparison is associated to flow. It compares two (or more) datasets, visualizations or data elements through split parallel or overlapping panels. By comparing, it could emphasis on quantity, disparity, growth, or position changes. Often, it is used to emphasize differences, as well as to perform similarly. It also reflects the objectivity of Data Comics.
Definition: Legend panel explains visual encodings for reference (e.g. legend for colour encoding) before explaining a complex visualisation. Legend panel is necessary when unfamiliar icons or various colours are used to present different meanings.
Definition: Exploration lays out panels in an intentionally non-sequential way, implying that panels are supplementary to the story. As though the pattern is similar to the infographics in form, the difference is that the exploration here is embedded in a story. Moreover, there should be a certain connection between different data points, despite readers are free to read, they still follow some inherited visual processes, for example, “Z – path” (Cohn and Campbell, 2015). Thus, the design for free exploration should be guided by the principles of readers’ visual habit.
Definition: Walkthrough is similar with exploration, basing on an infographic with multiple data points. Nevertheless, unlike the exploration, walkthrough superimposes a narrative sequence. This pattern is mostly applied on demonstrating space distribution and location change.
Definition: Exposé is a narrate pattern that aims to introduce the background and engage viewers at the beginning. It starts with a narrative illustration, motivating story and data. To start with narrative background rather than data is inclined to attract audiences.
Definition: Letting viewers Make-a-guess before revealing the fact aims to provoke thinking and interaction. It may provide alternatives for explanations or scenarios. The alternatives could be established by separate panels.
Definition: Flash back refers to a previous panel by repetition or a specific visual means (e.g. arrow). By pointing back, on one hand, it could uncover a temporal change, causality or invoke comparison. On the other hand, it emphasizes the key points mentioned above and strengthens the impression.
Definition: Gradual reveal shows the result or conclusion first and then reveal the fact. This pattern is designed for engaging the audience to further read or speculate.
Definition: Percentage panel is a visual pattern to present percentage. here, we see a panel as a bar chart, contents in illustration will be displayed in the panel with a size of the corresponding percentage.
Definition: Single picture spanning the entire page. [Groensteed]