Flow maps shows bilateral movement between geographical areas over time. The default map is a world map that can show movement between countries, but this map can be replaced by other maps to produce movements on different scales at any location.
<div class="flow-map" data-start-year="1990" data-end-year="2005" data-year-gap="5" data-bg-color="#192A3A" data-sending-color="#7E4C7F" data-receiving-color="#23787A" data-title="Title of the Map" data-description="Description goes here" data-sending-text="Sending" data-receiving-text="Receiving" data-text-color="#EFEFEF" data-map-color="#EFEFEF" data-show-social="true" data-overlay-text-post=" people"></div>
<script src="https://cdn.jsdelivr.net/gh/CodeForAfrica/FlowMaps@1.0/dist/javascript/flow-map.min.js"></script>
<link rel="stylesheet" type="text/css" href="https://cdn.jsdelivr.net/gh/CodeForAfrica/FlowMaps@1.0/dist/css/index.css" />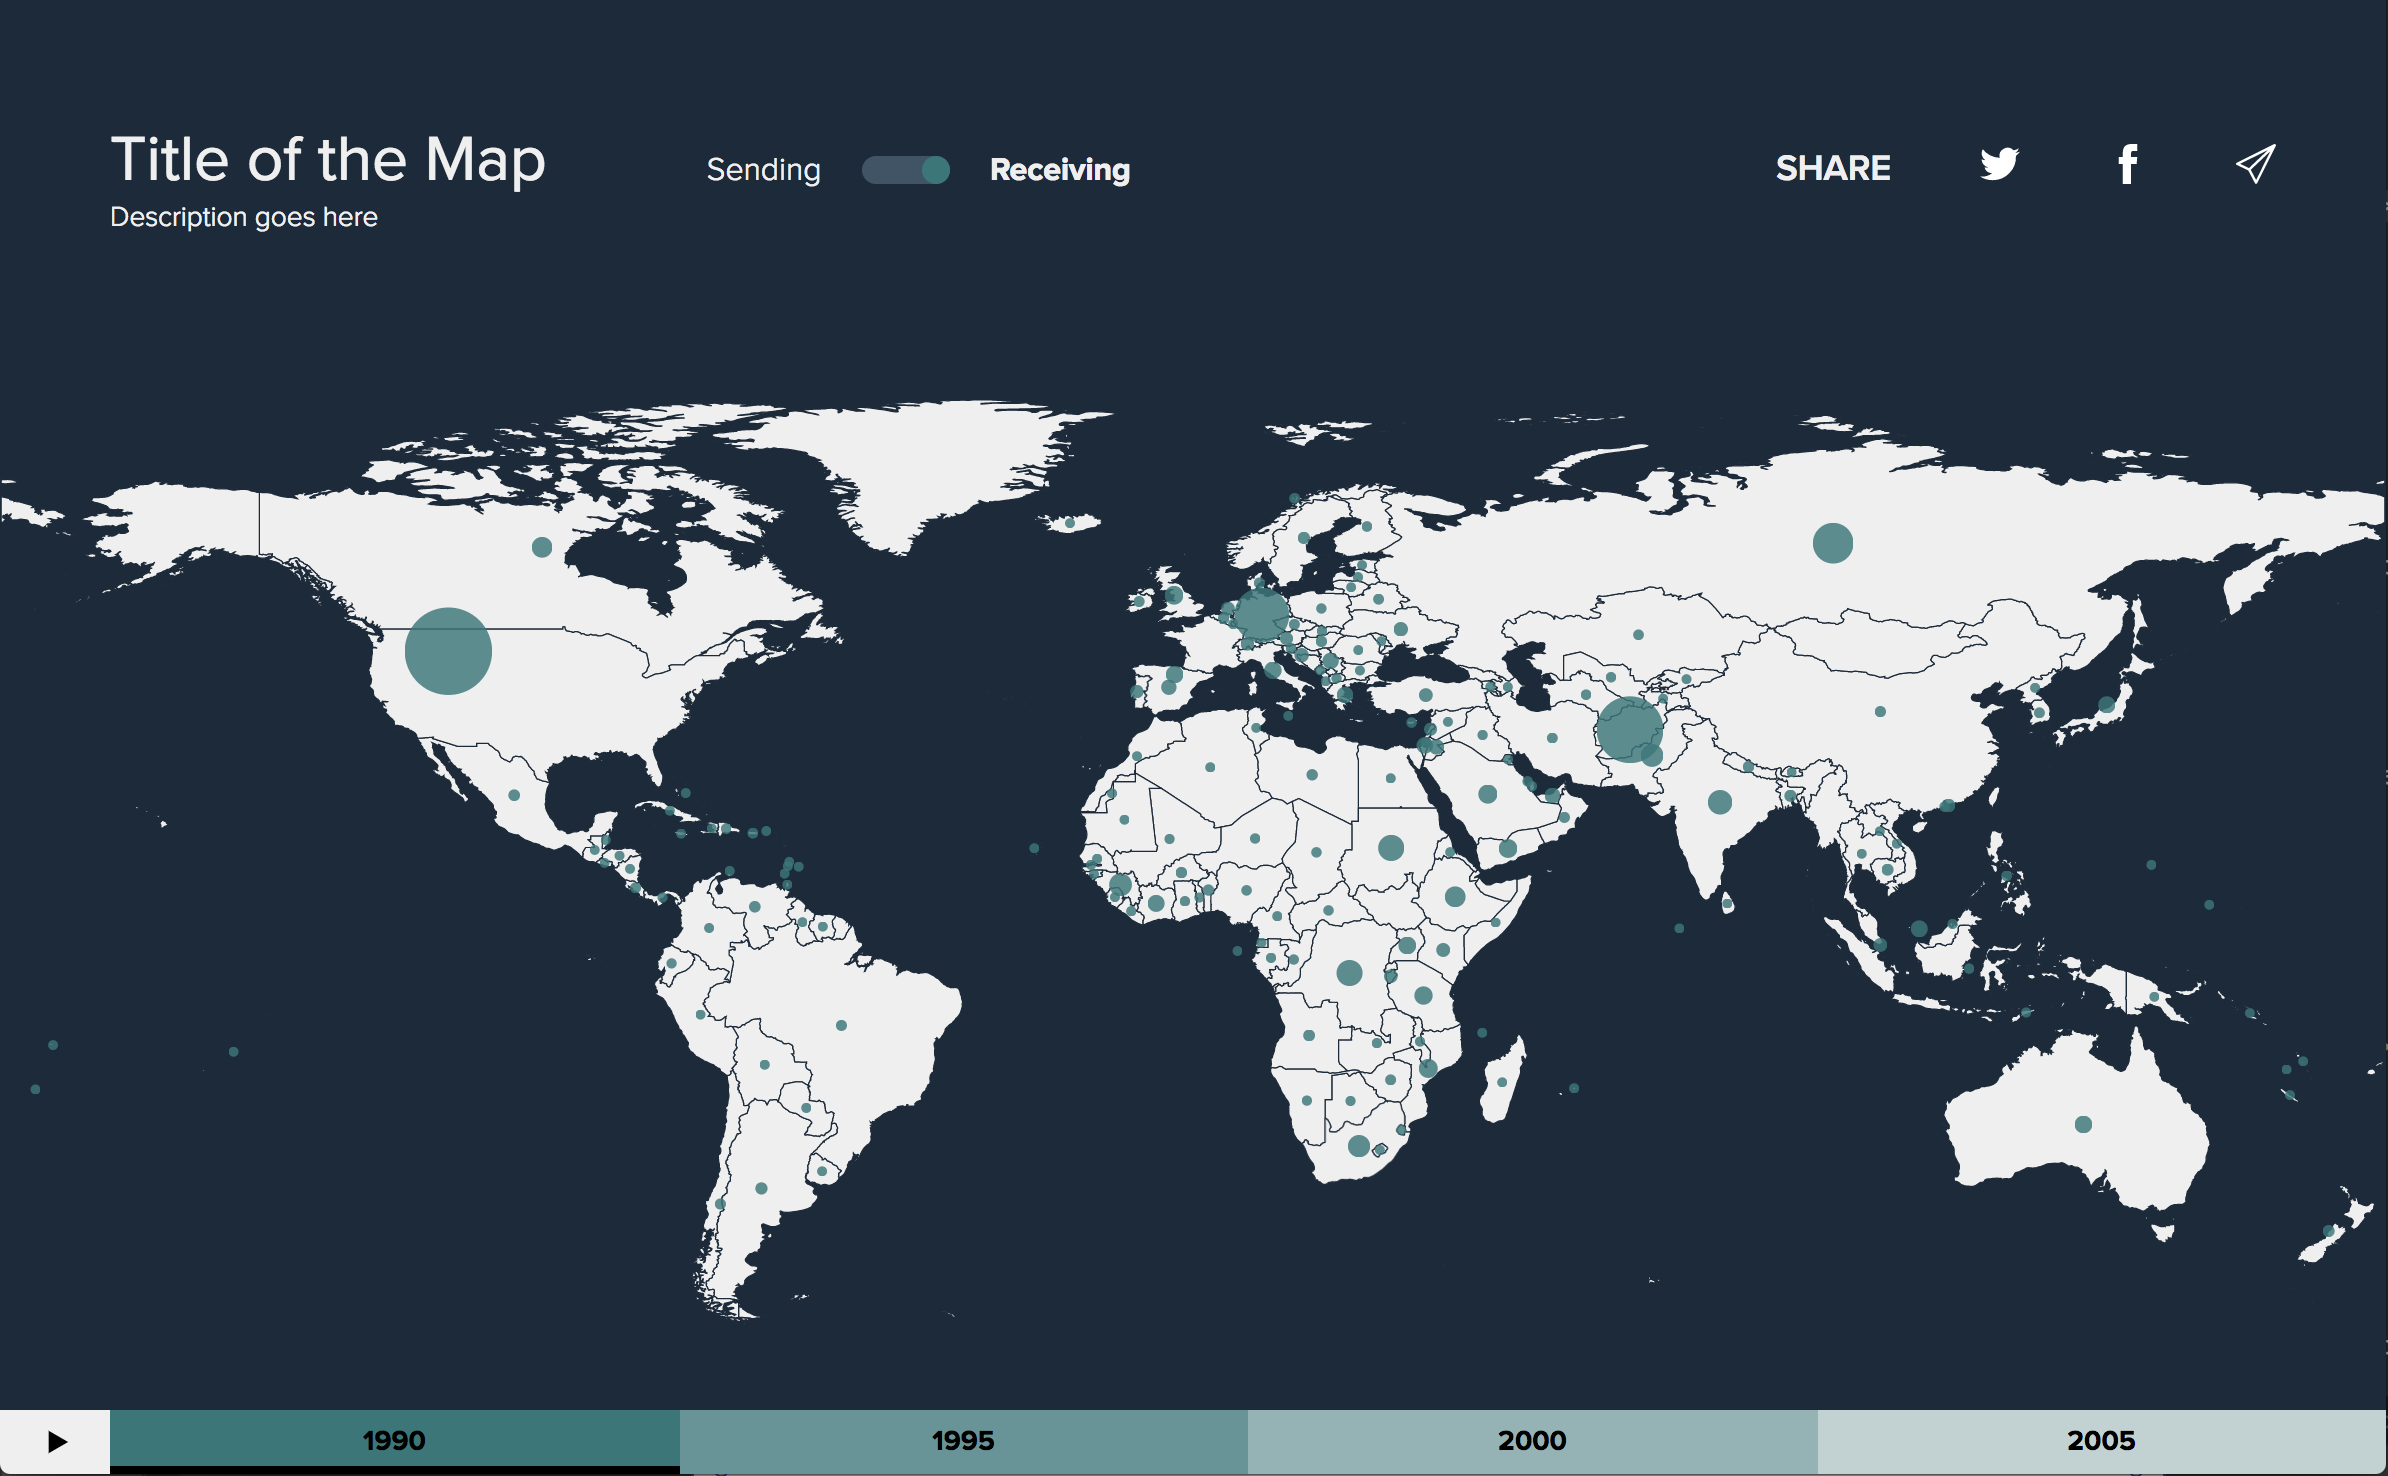
By default a world map will be displayed. To change this, link to an external TopoJSON file or overwrite the file at /data/topojson.json (see data-topojson for more information). To add your dataset link to an external csv file or overwrite the file at /data/data.csv (see data-data for more information). A second example dataset is saved at /data/african-aid.csv.
Flow maps uses data attributes to personalise the visualisation.
The first year for which data is present
The last year for which data is present
Title for the map
Description for the map
The number of years between each dataset. Default: 1
Background colour for the map. Default: '#192A3A'
Text colour for the title, description, switch and social menu. Default: '#EFEFEF'
Color for the map. Default: '#EFEFEF'
Sending colour for the map. Default: '#7E4C7F'
Receiving colour for the map. Default: '#23787A'
Label for "sending" direction switch option. Default: 'Sending'
Label for "receiving" direction switch option. Default: 'Receiving'
Whether or not to show the social menu. If set to true, the icons will populate the share content based on the og/meta tags in your website's <head> tag. Default: false
Text to appear on the overlay before the number, e.g. '£'. Default: ''
Text to appear on the overlay after the number, e.g. ' people'. Default: ''
A number to describe the ratio of map width to map height. For a full view of the world map this should always be the default 2.3415. Default: 2.3415
Magnification factor to display a zoomed map. Default: 1
X position of the centre of zoom. Default: '50%'
Y position of the centre of zoom. Default: '50%'
Link to an external TopoJSON file defining the map to be displayed. By default the world map will be displayed. You can also change the TopoJSON file by simply replacing the file in /data/topojson.json. The TopoJSON file must be valid TopoJSON and have exactly one geometry object named subunits and with type GeometryCollection.
Link to an external csv file containing the data to be visualized. By default the data will be pulled from /data/data.csv. You can replace this file with your own dataset. The data headings should be as follows: year,sending_name,receiving_name,amount.