App Workbench
The Workbench tab lists all your workbenches. A workbench connects a Template to a GitHub repository and produces a pull request.
flowchart LR
    A[Select Repo] --> B[Select Template]
    B --> C[Create Workbench]
    C --> D[Parsing]
    D --> E[Browse & Select]
    E --> F[PR into GitHub]
To open the Create Workbench screen, click the Workbench icon in the left sidebar (the circular arrow icon).
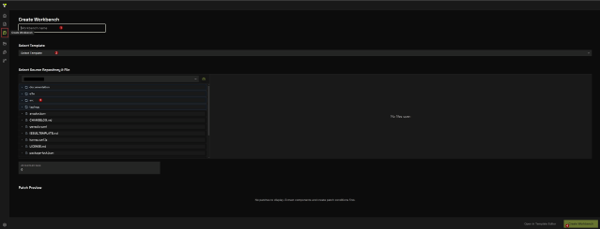
At the top of the screen, type a name for your workbench into the Workbench name field (1).
Click the Select Template dropdown (2) and choose the template you want to use (e.g., angularTemp). This is the grammar that will be applied to your repository.
Under Select Source Repository & File, a file tree of your repository appears (e.g., github/simpleDemo).
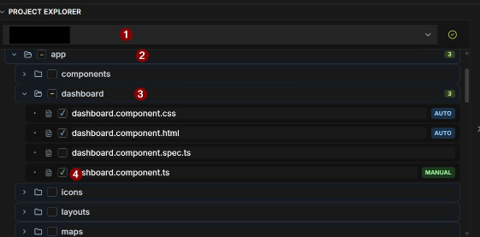
- Select your repository from the dropdown (1)
- Expand app (2)
- Expand dashboard (3)
- Check the files you want to include. Files show one of three states:
- AUTO (green) - Crodox can handle this file automatically
- MANUAL (green) - File is selected for manual review
- Unchecked - File is excluded from the workbench
For this example, check dashboard.component.ts (4) along with any other files in the dashboard folder.
The Affected Files counter at the bottom updates to show how many files will be included.
Scroll down to review the Patch Preview section, which shows what patches will be applied to the selected files.
When you are satisfied, click Create Workbench in the bottom-right corner to run the analysis.
Crodox parses the selected files using your template and generates the workbench results. The header shows the Repository and Project ID for the active workbench.
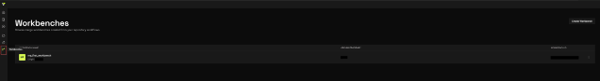
After you create a workbench, it appears in the Workbenches tab. The list displays all workbenches with the following columns:
| Column | Description |
|---|---|
| Workbench Name | The name you entered |
| Origin Repository | The GitHub repository analyzed |
| Workbench ID | Unique identifier for the workbench |
To open a workbench and browse its results, click on the workbench name or row.
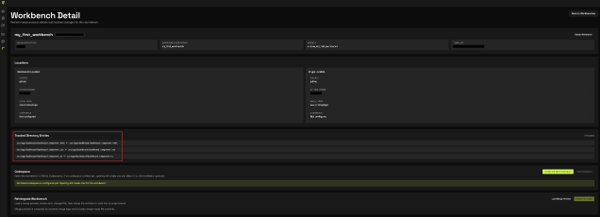
When you open a workbench, the detail view displays comprehensive information about the workbench and its results:
At the top of the screen:
- Workbench Name - The name you created
- Workbench ID - System-generated unique identifier
- Delete Workbench button (top-right) - Permanently remove this workbench
- Back to Workbenches button (top-right) - Return to the workbenches list
Four cards display key metadata:
| Card | Content |
|---|---|
| Origin Repository | Source repository |
| Workbench Status | Current workbench status |
| Title | Pull request title to be created |
| Created | Workbench creation timestamp |
Two location panels show source and workbench configuration:
| Location | Fields |
|---|---|
| Workbench Location | SOURCE, ARTIFACT OWNER, LOCAL PATH, CREDENTIALS status |
| Origin Location | Same structure as Workbench Location, showing the source repository configuration |
If CREDENTIALS shows "Not configured", you may need to set up GitHub authentication in Settings.
This section lists the files selected for this workbench and tracked for merge.
For the dashboard example, the 3 selected files are tracked:
src/app/dashboard/dashboard.component.csssrc/app/dashboard/dashboard.component.htmlsrc/app/dashboard/dashboard.component.ts
Any change you make in these tracked files is included in the workbench change set and becomes part of the merge preview.
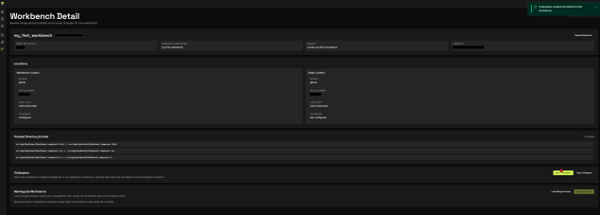
The Codespace section allows you to work on your workbench in a browser-based development environment:
- Create Codespace button - Create a new GitHub Codespace for this workbench (green button)
- Stop Codespace button - Stop a running codespace to free resources
When you click Create Codespace, GitHub provisions a cloud-based VS Code environment linked to this workbench. A confirmation message appears: "Codespace created and linked to this workbench."
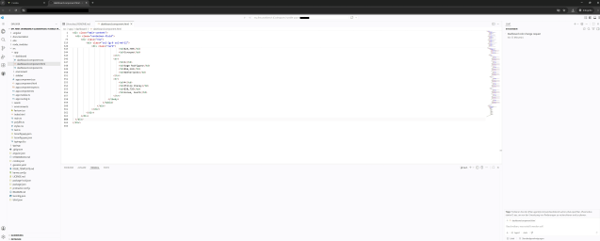
The Codespace opens a full VS Code environment in your browser, with the workbench repository already checked out. The file tree on the left shows the full project structure (e.g., src/app/dashboard/).
Important: The Codespace always compiles the project on startup. Wait for the build to complete before editing files or reviewing changes. You can monitor progress in the Terminal panel at the bottom of the screen.
The right-hand Chat panel shows session history and allows you to interact with Copilot for planning changes. A Codespace tip is shown: "Try the Plan agent (@workspace /action chat.openPlan) to research and plan changes before implementing them."
After editing tracked files (for example inside Codespaces), use this section to finalize and merge:
- Click Refresh Preview to recompute changes from the tracked files
- Review each changed file and diff in the merge preview
- Click Merge Into Origin to commit the workbench changes and merge them back into the origin branch
Once merged, your updates from the tracked files are committed and reintegrated into the original repository branch.
Once you open a workbench, you can browse the parsed components and create a pull request.
After selecting files and objects with the checkboxes:
- Crodox uses the Dependency Structure to ensure the PR is coherent
- The PR is pushed to your linked GitHub repository