Multiple Year Stock Analysis - VBA Script
This VBA script analyzes stocks listed in multiple worksheets in an Excel workbook. Each worksheet contains a table with the following columns: ticker, date, open, high, low, close, and vol. The script performs the following calculations:
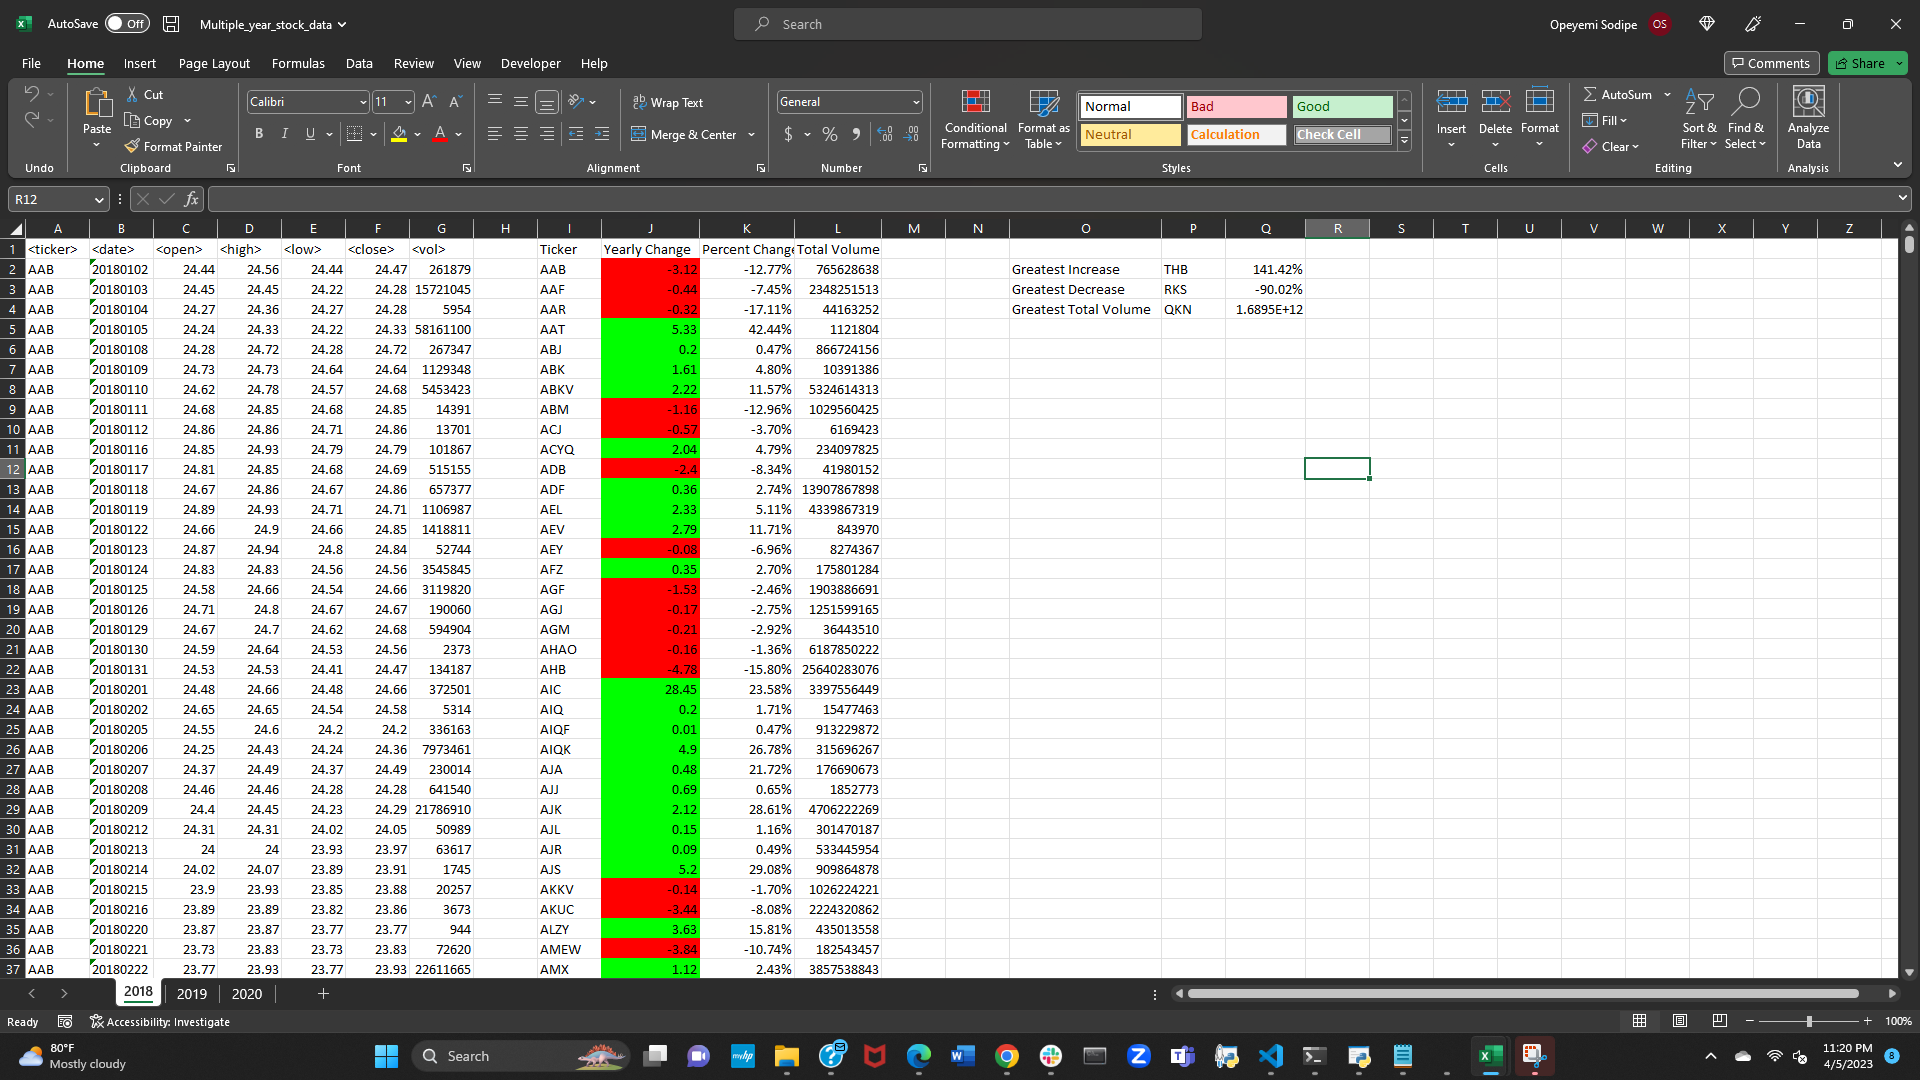
Yearly change from the opening price at the beginning of a given year to the closing price at the end of that year The percentage change from the opening price at the beginning of a given year to the closing price at the end of that year Total volume for each stock Based on these calculations, the script identifies the stocks with the:
Greatest % Increase Greatest % Decrease Greatest total volume For each worksheet, the script creates a summary table that lists the ticker symbol, yearly change, percent change, and total volume. It also displays the stocks with the greatest percent increase, greatest percent decrease, and greatest total volume.
Additionally, the script uses conditional formatting to highlight positive changes in green and negative changes in red for easy visualization.
How to use the script
- Press ALT + F8 to open the "Macro" dialog box.
- Select the macro named "mdStocksAnalysis" and Alphabetical_testing respectively, click "Run" to execute the VBA script.
- The script will loop through all the worksheets in the workbook, calculate the required information, and output the results in a summary table within each worksheet. Positive and negative yearly changes will be highlighted in green and red, respectively, using conditional formatting as shown below.