ad.py: Uses ldap and pandas to connect to an Active Directory Domain Controller and build a DataFrame with information about all member computers.
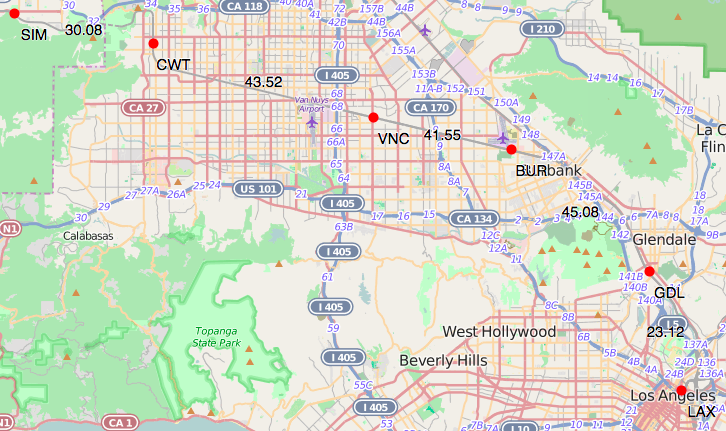
basemap.py: Uses Basemap and CoreLocation (via PyObjC), and bumpy to generate a map and highlight your location.
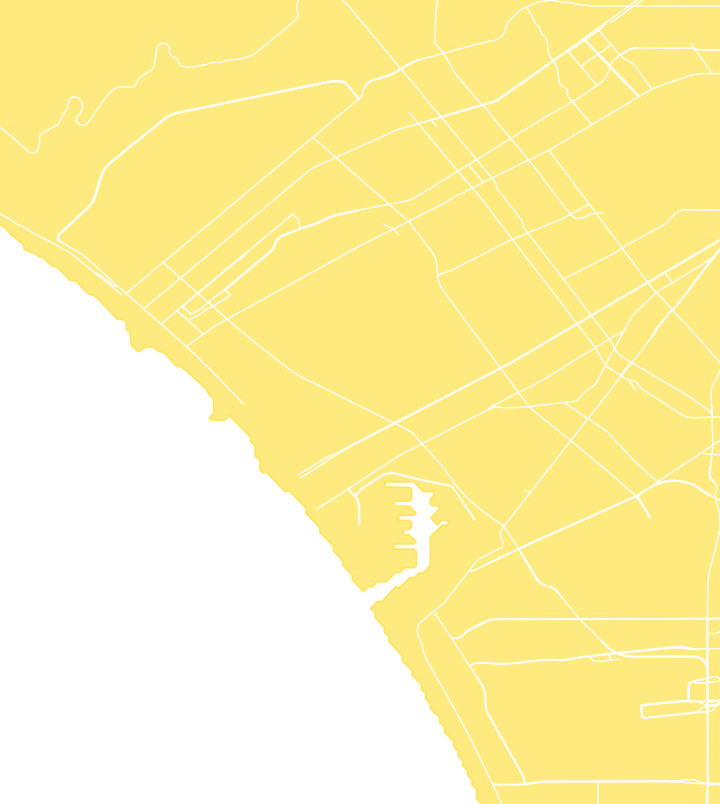
county-map.py: Uses overpy (openstreetmap), numpy, matplotlib, shapely, descartes, and fiona to build a fancy map of Los Angeles County.
csv 2 json or html.py: Uses pandas and json to convert a csv to a json file or an html table.
delicious.py: Convert del.icio.us bookmarks to a .csv file.
finance.py: Financial calculators.
flowPairCheck.py: Uses pandas and numpy to check for communications between a list of clients and a list of servers in netflow traffic.
freq.py: Uses pandas and matplotlib to plot a frequency.csv file.
getFlows.py: Uses lxml, pycurl, and pandas to query a Lancope API and download Netflows to a .csv file.
gis.py: Playing around with fiona, shapely, and descartes to draw maps.
gpx.py: Uses gpxpy to convert a gpx file into a list of points.
highwayDesign.py: Uses sympy to solve equations about Highway Design.
iphorse.py: Uses requests and yaml to find your public IP address and return it as yaml.
map-state.py: Uses overpy (openstreetmap), numpy, matplotlib, shapely, descartes, and fiona to build a fancy map of California.
movies.py: Uses pandas and requests to query the Open Movie Database.
nessus_report.py is a Python script that take a SQLite database containing Nessus vulnerability scan results, processes, them, and generates PDF reports. It is intended for large multi-department organizations that need to quickly sort through large amounts of scan data and create relevent reports for each department.
- Run a Nessus scan. Export the results as a .csv file.
- Add a department column with each department's name to each scan result file.
- Import the .csv files into a SQLite database.
- Run nessus_report.py.
oktaAppSAML.py: Create, view, modify and delete SAML apps in Okta.
oktaDiff*.py: Compare users in Okta with users in a csv or text file or users in Dropbox, Salesforce, or Slack.
pandas-stacked-bar.py: Create a simple stacked bar graph with Pandas.
pie.py: Connect a bunch of sensors to a Rasbperry Pi.
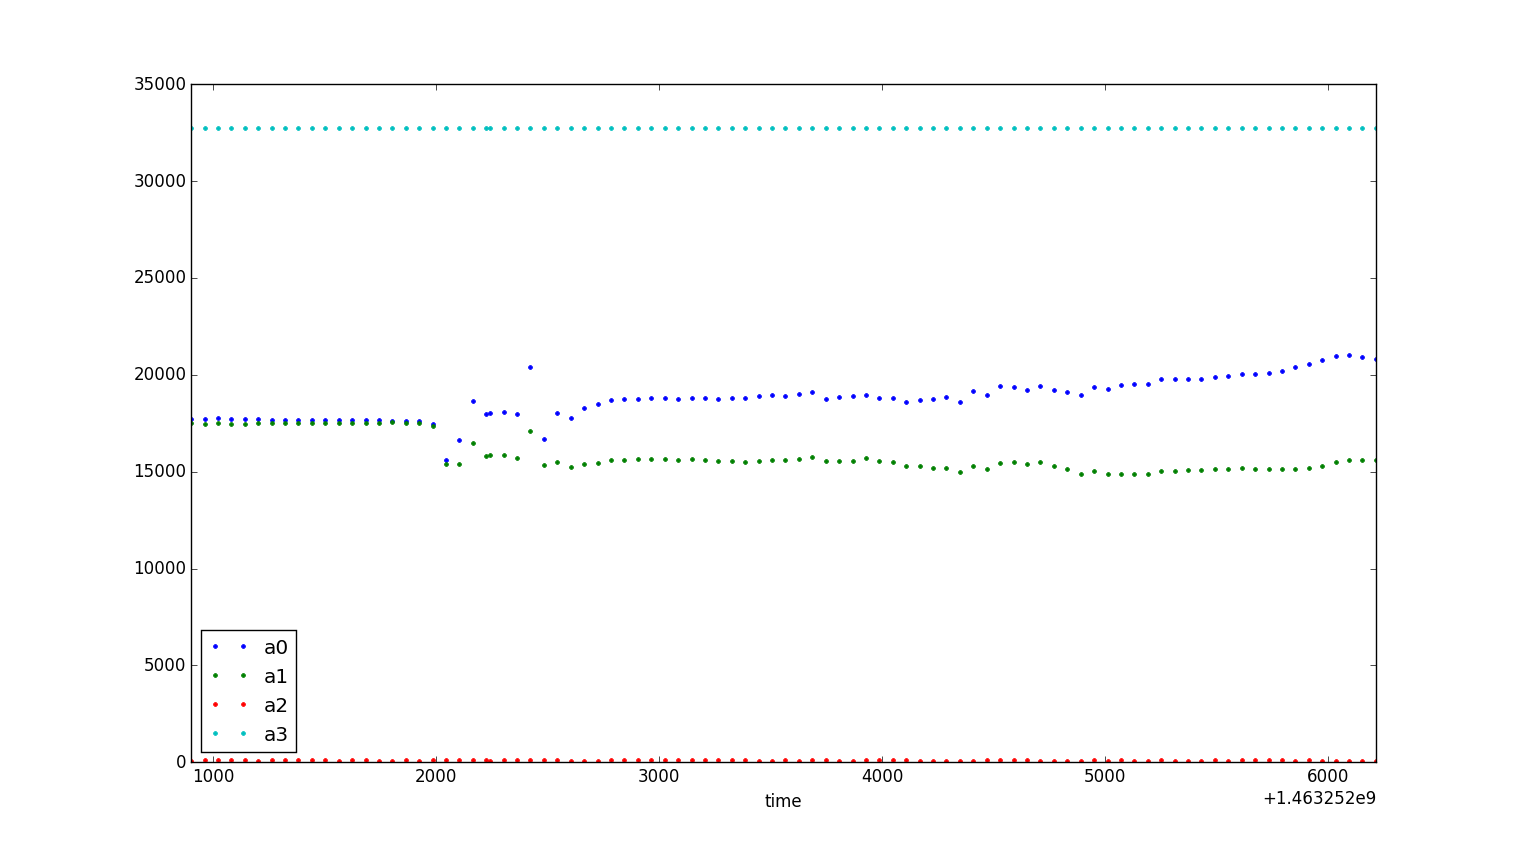
pieSensors.py: Read values from sensors over time, save the values to a csv, and plot the values for analysis.
podcast.py: Create a podcast feed from a list of YouTube videos.
railRadius.py: Calculate the maximum radius along a way from OpenStreetMap. For use with https://davidbailey.github.io/rail.
risk.py: Playing around with plots.
salesforceDisableUsers.py: Bulk disable Salesforce users who are in Stage, but not in Prod.
speeds.py: Uses pandas, numpy, gtfstk, shapely, matplotlib, geopandas, and bottle to plot
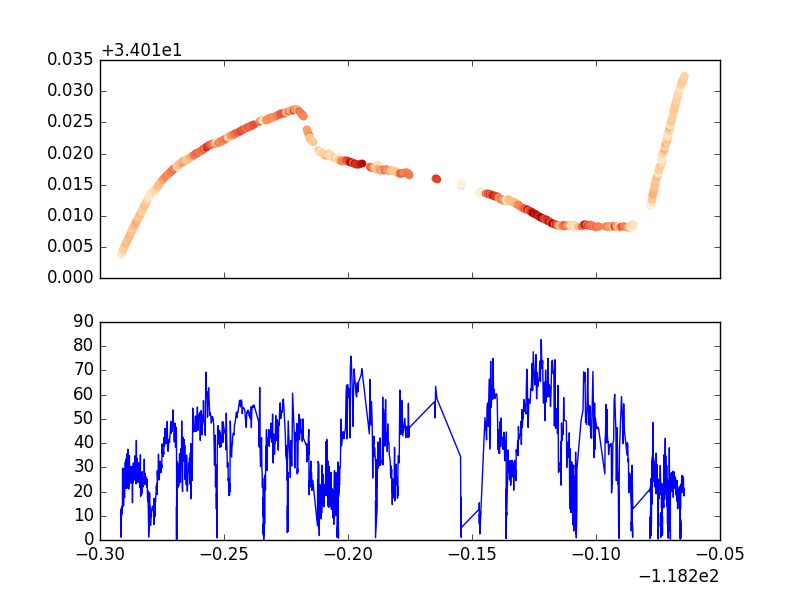
speeds2.py: Uses gpxpy, shapely, geopandas, numpy, and matplotlib to calculate the speed at each point along a GPS track and plots that speed on a map.
splunk.py: Uses the Splunk API, geoip, ipwhois, pandas, numpy, and re to look up recent successful logins and track down the client computer.
splunkfile.py: Uses pandas and re to search through a spunk.csv file and find successful logins.
stocks.py: Playing around with lots of modules to look at stock market data, compute regressions, and create simulations.
trafficSim.py: A traffic simulation. Still in development. Moving to using Scala: https://github.com/davidbailey/TransportSim
transportationBook.py: Playing with examples from Dr. Christopher M. Monsere's textbook (http://web.cecs.pdx.edu/~monserec/t.data/).
usc.py: Uses pandas, matplotlib, numpy, and cartopy to look at USC's success in the Olympics.
walkbike2015.py: Used to gather the census data and zip code geometries for https://davidbailey.github.io/bicycle.html and https://davidbailey.github.io/walked.html.
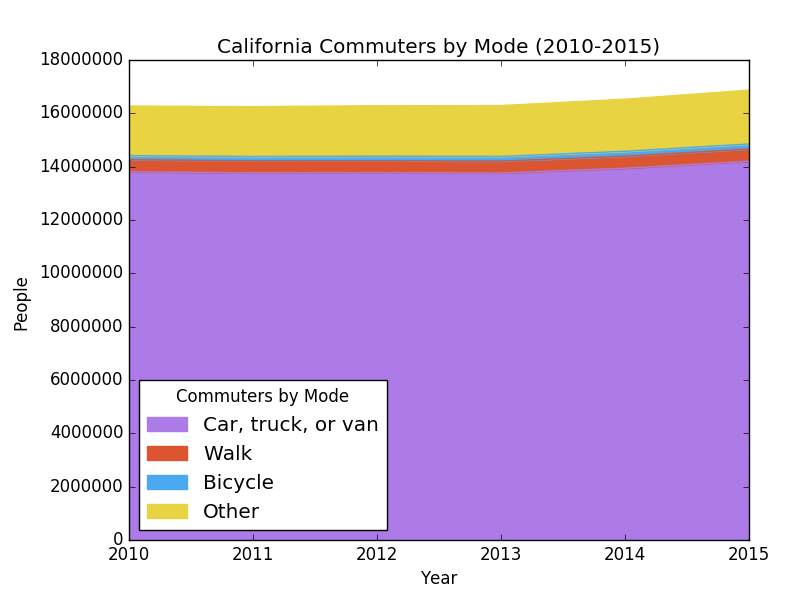
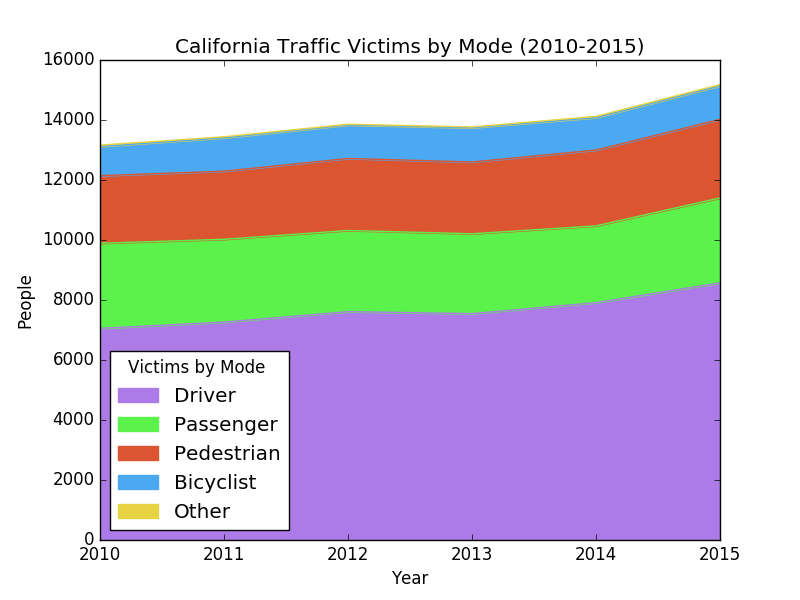
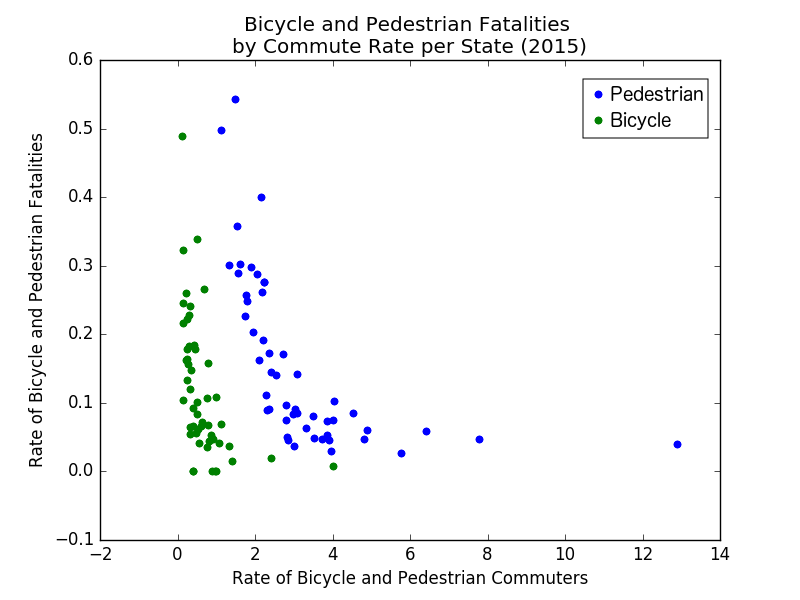
walkingcycling.py: Data analysis and visualization of United States and California transportation census and fatality/injury data for https://github.com/davidbailey/tum/blob/master/The_Feedback_Loop_of_Cycling_and_Walking/The_Feedback_Loop_of_Cycling_and_Walking.pdf.
modules: A list of modules used in these files.
