This repository contains the project work for the Bayesian Data Analysis course, exploring Robust Regression using a Bayesian framework. The goal is to compare traditional and robust regression models when dealing with datasets containing outliers or extreme values.
This repo includes:
normal_model.stan– Traditional regression model assuming normality of residuals.normal_model_QR_reparametrization.stan– Normal regression model with QR reparametrization to improve convergence.robust_model.stan– Regression model assuming a t-distribution for residuals, improving robustness to outliers.demo.R– A working file to fit models and reproduce results.
This project builds a Bayesian Robust Regression model using Stan. The demo.R script demonstrates how to fit models and analyze results. Data details can be found at Springer.
Standard regression assumes normally distributed residuals. However, in real-world datasets, outliers can skew results. A robust approach models errors with a t-distribution, which has fatter tails, reducing outlier influence.
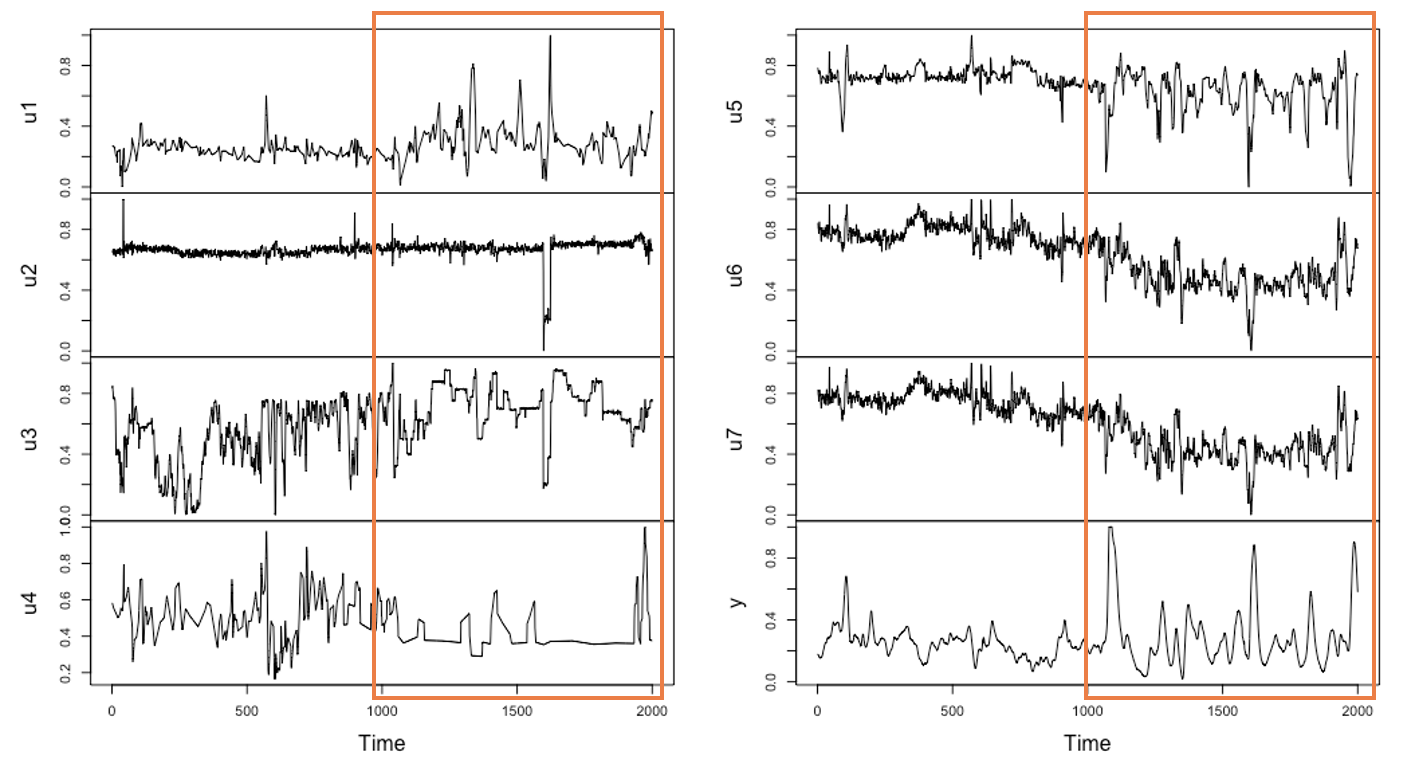
📊 Dataset: The training set consists of 1000 observations (orange-highlighted), containing unusual trends from a debutanizer column dataset.
-
Normal Regression:
- Assumes residuals follow
$\epsilon \sim N(0, \sigma)$ - Model:
$y \sim N(\alpha + \beta x, \sigma)$
- Assumes residuals follow
-
Robust Regression (t-distribution):
- Allows heavy-tailed errors, reducing outlier impact.
- Model:
$y \sim t(\nu, \alpha + \beta x, \sigma)$ - Parameter ν controls tail fatness.
-
$\alpha \sim N(0, 10)$ (Intercept) -
$\beta \sim N(0, 10)$ (Coefficients) -
$\sigma \sim \text{Inv-}\chi^2(10)$ (Error scale) -
$\nu \sim \chi^2(5)$ (Degrees of freedom for t-distribution)
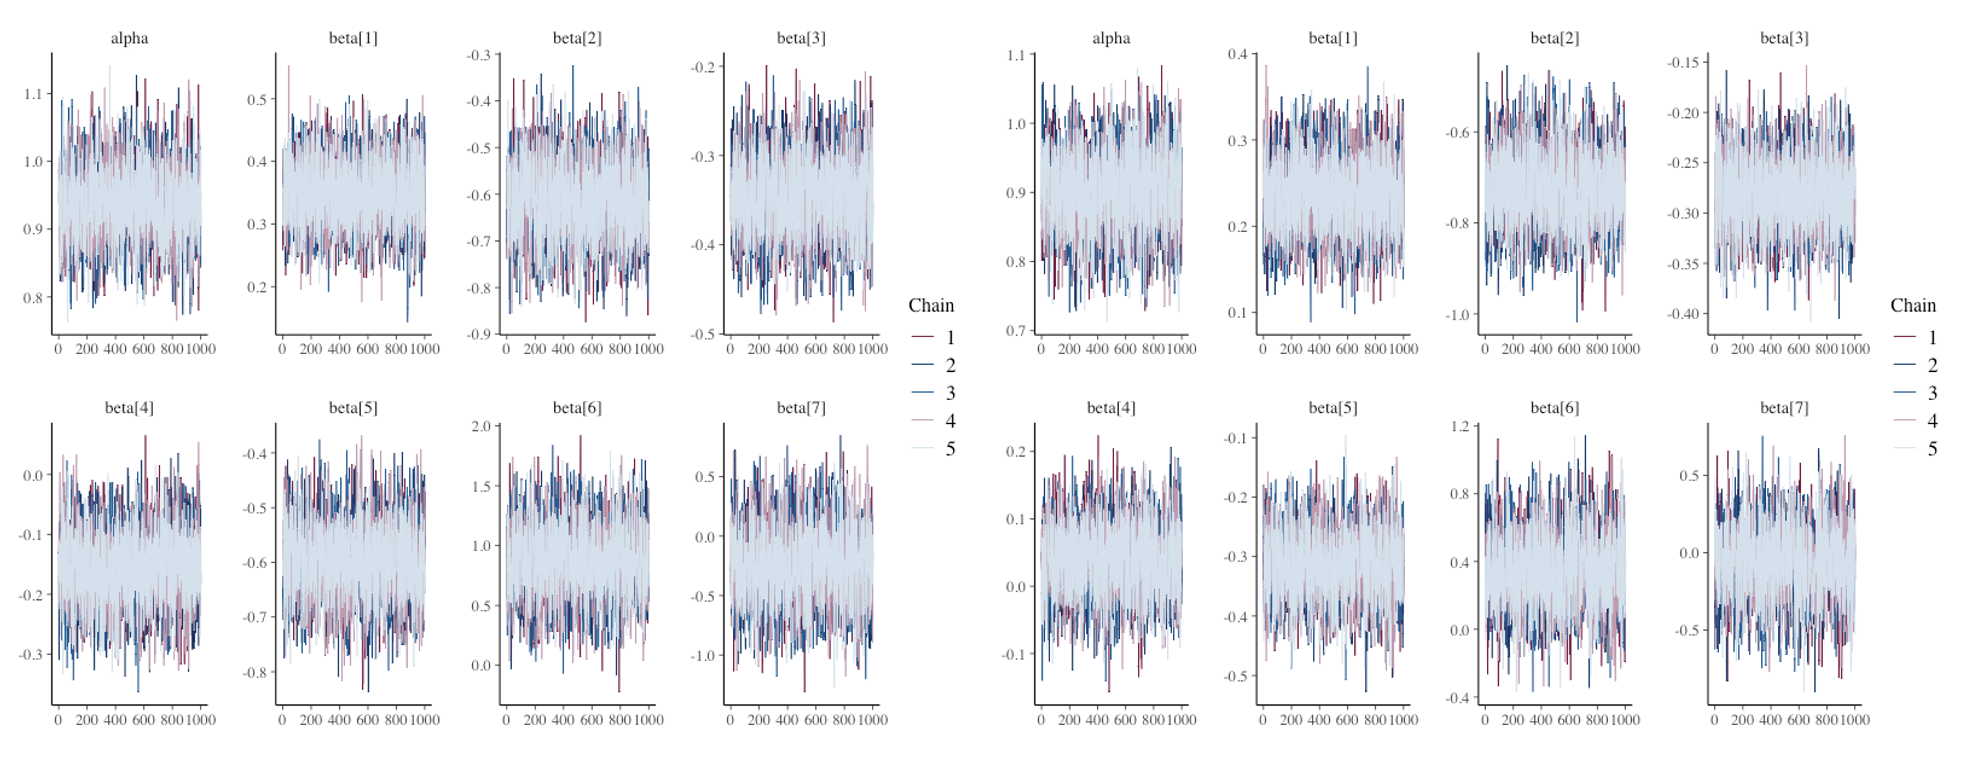
Below are the Markov Chains for normal (left) and robust (right) regression parameters (α and β). All parameters show satisfactory R-hat values ≈1, indicating good convergence.
We use LOO scores and PSIS diagnostic plots. A well-specified model should have k ≤ 0.7.
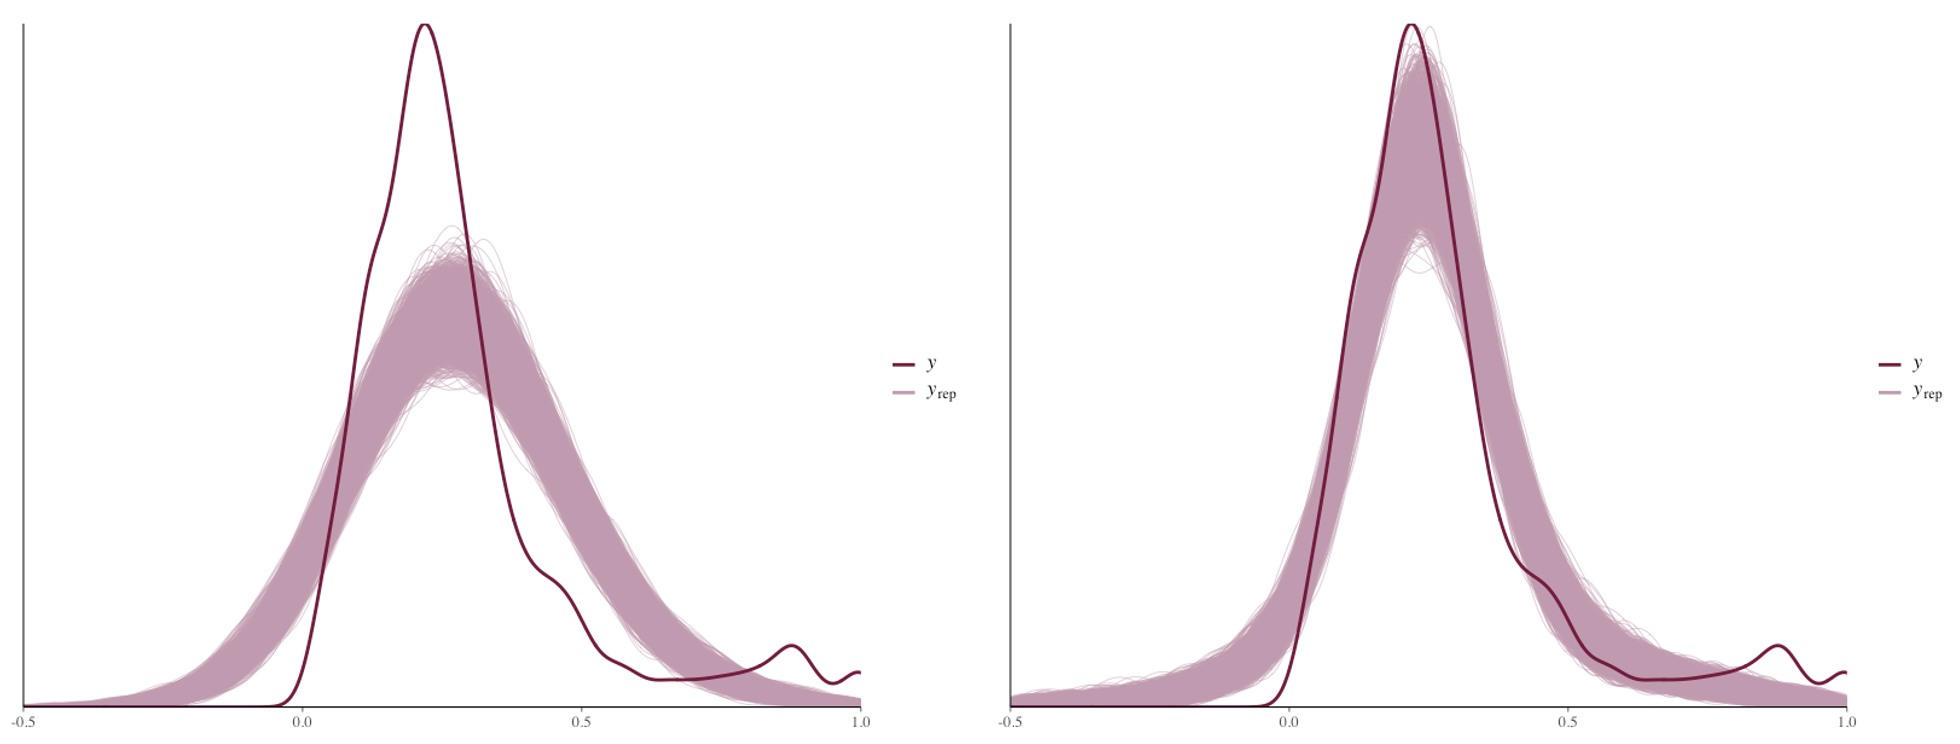
Additionally, we compare the two models using y_rep values, where posterior predictive checks are performed by simulating new data points and comparing them with real values.
Left: Normal Regression | Right: Robust Regression
Predicting new observations using Root Mean Squared Error (RMSE):
- Normal Regression: RMSE = 0.210
- Robust Regression: RMSE = 0.144 (Lower is better!)
The robust regression model outperforms the normal model, handling outliers more effectively.


