Utilisation
Cette section inclus des exemples d'utilisation de l'intégration. Le projet ne supporte pas ces exemples, il devrait vous servir de base pour construire ou vous donner des idées. Si vous avez besoin d'aide, veuillez utiliser le forum de HA ou cette discussion
Les exemples qui ont un requis particulier de type "custom:*" nécessite d'installer ces composant. Soit via HACS ou via la méthode manuelle.
Requis particulier:
- custom:paper-buttons-row
Contributeur:
Capture d'écran

yaml Code
- type: vertical-stack
  cards:
    - type: custom:paper-buttons-row
      buttons:
        - type: entity
          entity: sensor.hilo_gateway
          name: false
          action: none
          state: false
          state_styles:
            'on':
              button:
                color: green
            'off':
              button:
                color: red
        - type: entity
          entity: sensor.defi_hilo
          state: false
          action: none
          state_styles:
            'on':
              button:
                color: red
            scheduled:
              button:
                color: yellow
            pre_heat:
              button:
                color: red
            recovery:
              button:
                color: blue
            'off':
              button:
                color: green
        - type: entity
          entity: sensor.meter00_power
          name: false
          layout: icon|state
          action: none
          state: '{{ states(config.entity) }}'
          icon: mdi:speedometer
          style:
            button:
              color: |-
                {% if states(config.entity) | int > 1000 %}
                  yellow
                {% elif states(config.entity) | int > 1500 %}
                  orange
                {% elif states(config.entity) | int > 2000 %}
                  red
                {% else%}
                  green
                {% endif %}
        - type: entity
          entity: sensor.hilo_rate_current
          name: false
          layout: icon|state
          action: none
          state: '{{ states(config.entity) }}'
          style:
            button:
              color: |-
                {% if states(config.entity) | float > 0.07 %}
                  yellow
                {% elif states(config.entity) | float > 0.1 %}
                  red
                {% else%}
                  green
                {% endif %}
    - type: energy-date-selection
    - type: energy-sources-table
    - type: energy-usage-graph
    - type: energy-distribution
      link_dashboard: true
Requis particulier:
- custom:apexcharts-card
Contributeur:
Dans ce graphique, vous devrez ajuster les threshold selon votre consommation. Vous pouvez également ajuster la moyenne qui est fait au 5 minutes dans le group_by, duration.
Capture d'écran

yaml Code
- type: horizontal-stack
  cards:
    - type: custom:apexcharts-card
      header:
        show: true
        show_states: true
      experimental:
        color_threshold: true
      graph_span: 12h
      all_series_config:
        stroke_width: 4
      series:
        - entity: sensor.meter00_power
          unit: W
          type: column
          color_threshold:
            - value: 0
              color: cyan
            - value: 1000
              color: green
            - value: 1500
              color: orange
            - value: 2500
              color: red
          group_by:
            duration: 5min
            func: avg
Requis particulier:
- custom:apexcharts-card
Contributeur:
Dans ce graphique, vous devrez ajuster les nom des title et entity. Vous pouvez également ajuster les couleurs des lignes et ajouter d'autres thermostat et ajoutant des sections "- type: custom:apexcharts-card".
Capture d'écran

yaml Code
- type: horizontal-stack
  cards:
    - type: custom:apexcharts-card
      header:
        show: true
        title: Chambre principale
        show_states: true
        colorize_states: true
      graph_span: 8h
      cache: true
      series:
        - entity: climate.thermostat_chambre1
          attribute: current_temperature
          name: Temperature
          color: red
          fill_raw: last
        - entity: climate.thermostat_chambre1
          attribute: temperature
          name: Consigne
          fill_raw: last
    - type: custom:apexcharts-card
      header:
        show: true
        title: Chambre 2
        show_states: true
        colorize_states: true
      graph_span: 8h
      cache: true
      series:
        - entity: climate.thermostat_chambre2
          attribute: current_temperature
          name: Temperature
          color: red
          fill_raw: last
        - entity: climate.thermostat_chambre2
          attribute: temperature
          name: Consigne
          fill_raw: last
    - type: custom:apexcharts-card
      header:
        show: true
        title: Chambre 3
        show_states: true
        colorize_states: true
      graph_span: 8h
      cache: true
      series:
        - entity: climate.thermostat_chambre3
          attribute: current_temperature
          name: Temperature
          color: red
          fill_raw: last
        - entity: climate.thermostat_chambre3
          attribute: temperature
          name: Consigne
          fill_raw: last
Requis particulier:
- custom:auto-entities
Contributeur:
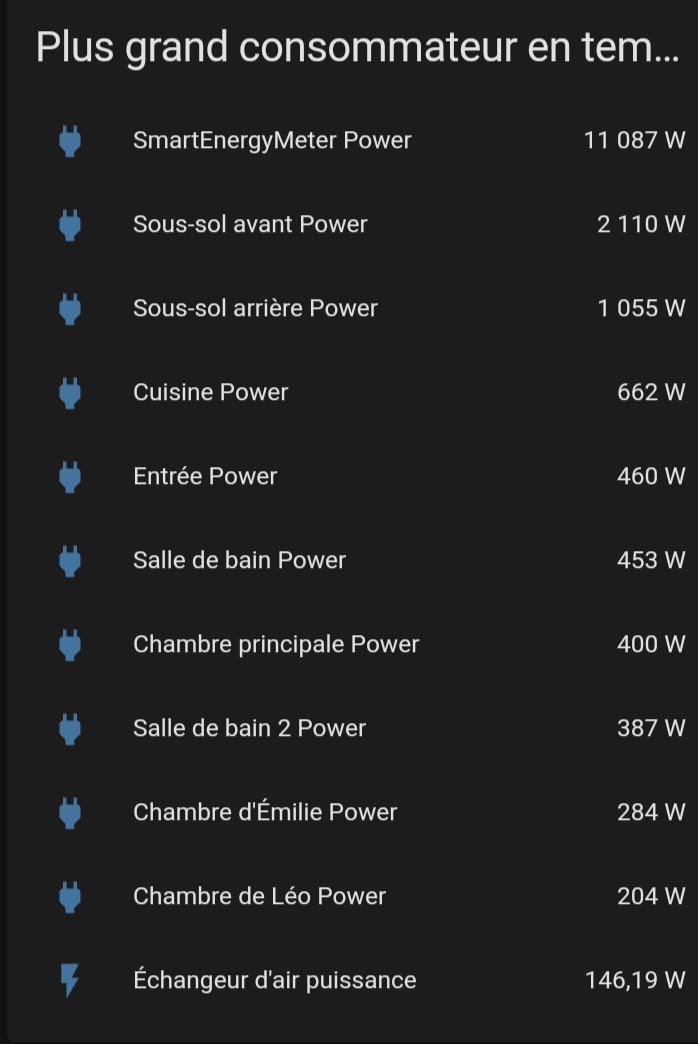
Ce graphique dynamique affiche TOUT les sensors qui ont le mot "power" dedans et qui affiche une consommation. S'ils tombent à 0, ils disparaissent de la liste. C'est intéressant pour voir pendant un défi si quelque chose ne fonctionne pas comme prévu.
Capture d'écran
yaml Code
- type: custom:auto-entities
  card:
    type: entities
    title: Plus grand consommateur en temps réel
    state_color: true
  filter:
    include:
      - domain: sensor
        entity_id: '*power*'
    exclude:
      - state: unavailable
      - state: unknown
      - state: '0'
      - state: '0.0'
  sort:
    method: state
    numeric: true
    reverse: true