This is a sample project on creating a data pipeline from files with different formats such as csv, json & xml to a PostgreSQL database acting as a data warehouse. The 'retail' PostgreSQL database is configured as a DWH that can be used for analysis and reporting purposes. Below is the use case I have considered when building the data pipeline:
The Retail.SA company wishes to build a data repository that allows it to learn more about its customers and make decisions to improve its service and operation.
-
Develop a basic Architecture for the development of the solution
-
Apply Extraction, Transformation and Load with Python
-
Respond to the following statements:
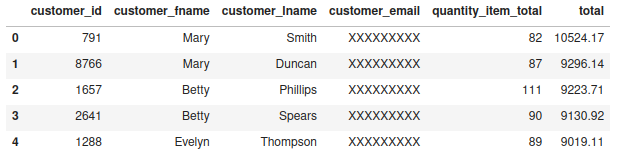
• Statement 1: Show a Top 20 customers who bought more products with their respective amounts.
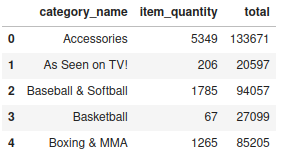
• Statement 2: Show the categories with the total number of products sold and the total amounts per category.
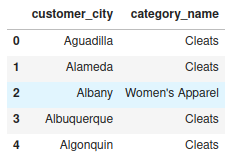
• Statement 3: Show the best-selling category by city
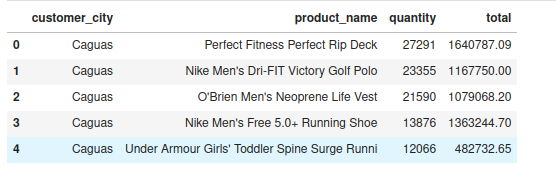
• Statement 4: Show the 5 best-selling products for each city and the amount collected
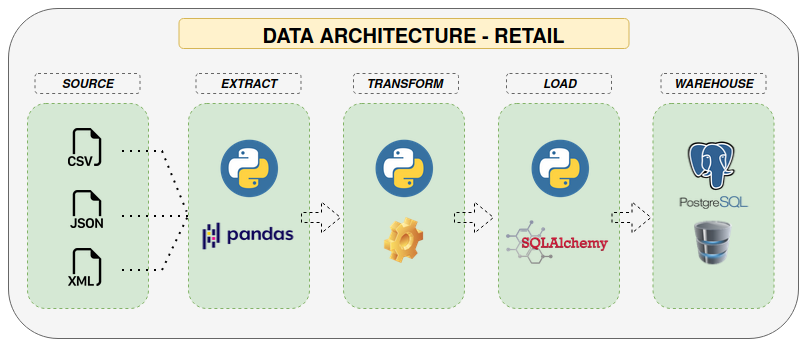
The first step that we must take into account when designing our data pipeline is to identify the place where it is located, be it a database, flat file, web, among others. For this case, it is identified that the sources are files with different formats such as csv, tsv, json, and xml.
Since we are going to use python, the next step is to identify the library that allows us to read the data and convert it to a data frame, in this case 'pandas' is used, however, other libraries such as 'pyspark' can also be used.
To develop the transformations and answer business questions, we use 'class' and 'pandassql'.
To load the data to the data warehouse we use the SQLAlchemy library which allows us to connect to the PostgreSql database and store the gold data.
Since it is a simple data pipeline, other features such as data orchestration and data governance are not being considered.
Finally, the data architecture would be the following:
To see the solution of the following points, check the folder "ProyectoETL"
Show a Top 20 customers who bought more products with their respective amounts.
Show the categories with the total number of products sold and the total amounts per category.
Show the best-selling category by city
Show the 5 best-selling products for each city and the amount collected