[DOCS] Risk score enhancements #2580
There are no files selected for viewing
| Original file line number | Diff line number | Diff line change |
|---|---|---|
| @@ -1,7 +1,7 @@ | ||
| [[host-risk-score]] | ||
| == Host risk score | ||
|
|
||
| NOTE: This feature is available for {stack} versions 7.16.0 and newer and requires a https://www.elastic.co/pricing[Platinum subscription] or higher. | ||
|
|
||
| The host risk score feature highlights risky hosts from within your environment. It utilizes a transform with a scripted metric aggregation to calculate host risk scores based on alerts that were generated within the past five days. The transform runs hourly to update the score as new alerts are generated. | ||
|
|
||
|
|
@@ -24,91 +24,235 @@ The following table shows how risk levels are applied to a host, based on the no | |
|
|
||
| |============================================== | ||
|
|
||
| [[enable-host-risk-score]] | ||
| [discrete] | ||
| === Enable host risk score | ||
|
|
||
| NOTE: To enable the host risk score feature, you must have alerts in your environment. If you previously enabled host risk score and are upgrading the {stack} to 8.5 or newer, refer to <<upgrade-host-risk-score>>. | ||
|
|
||
| You can enable host risk score from the following places in the {security-app}: | ||
|
|
||
| * The Entity Analytics dashboard | ||
| * The *Host risk* tab on the Hosts page | ||
| * The *Host risk* tab on a host's details page | ||
|
|
||
| Or, in {kib}, you can enable host risk score in Console. | ||
|
Contributor
There was a problem hiding this comment. @angorayc @SourinPaul Do we still want to point users to the Dev Tools installation? There was a problem hiding this comment. @ajosh0504 Only keep this as a reference in the documentation for 8.5. If I recall, @angorayc suggestion was to retain this as a backup mechanism given the dashboard enablement is just introduced and we dont have any data from real-life enablement. I think there is no harm in retaining it unless we are confident of the onboarding process and then remove it from the documentation as well.
Contributor
There was a problem hiding this comment. I remember in our previous discussion that we wanted to keep enable via dev tools in the doc, but I'm totally agree if we want to remove it in the future. |
||
|
|
||
| To enable host risk score from the Entity Analytics dashboard: | ||
|
|
||
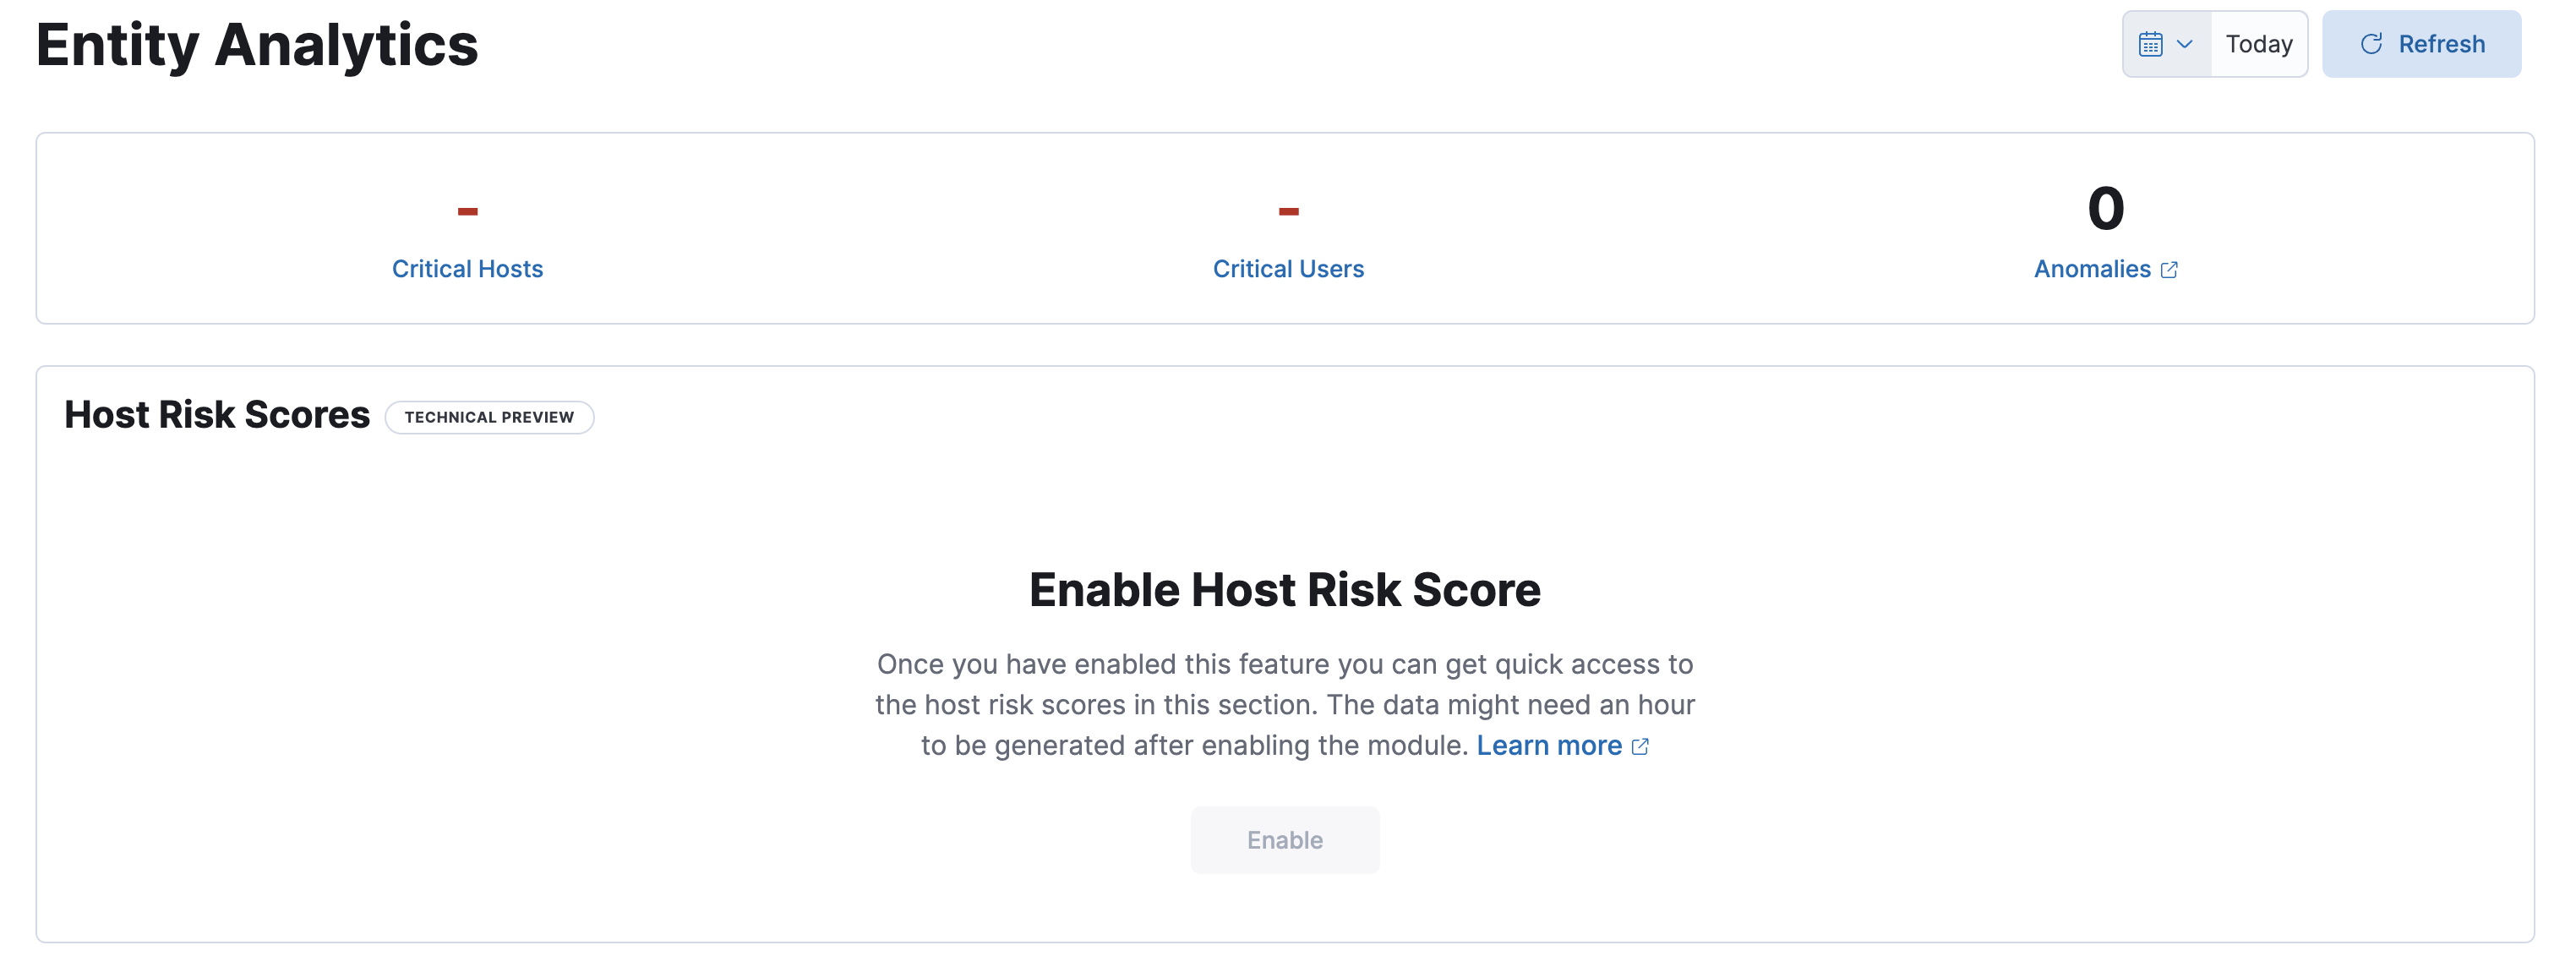
| . In the {security-app}, go to *Dashboards* -> *Entity Analytics*. | ||
| . In the Host Risk Scores section, click *Enable* to install the module. | ||
|
|
||
| To enable host risk score from the Hosts page: | ||
|
|
||
| . Go to *Explore* -> *Hosts*. | ||
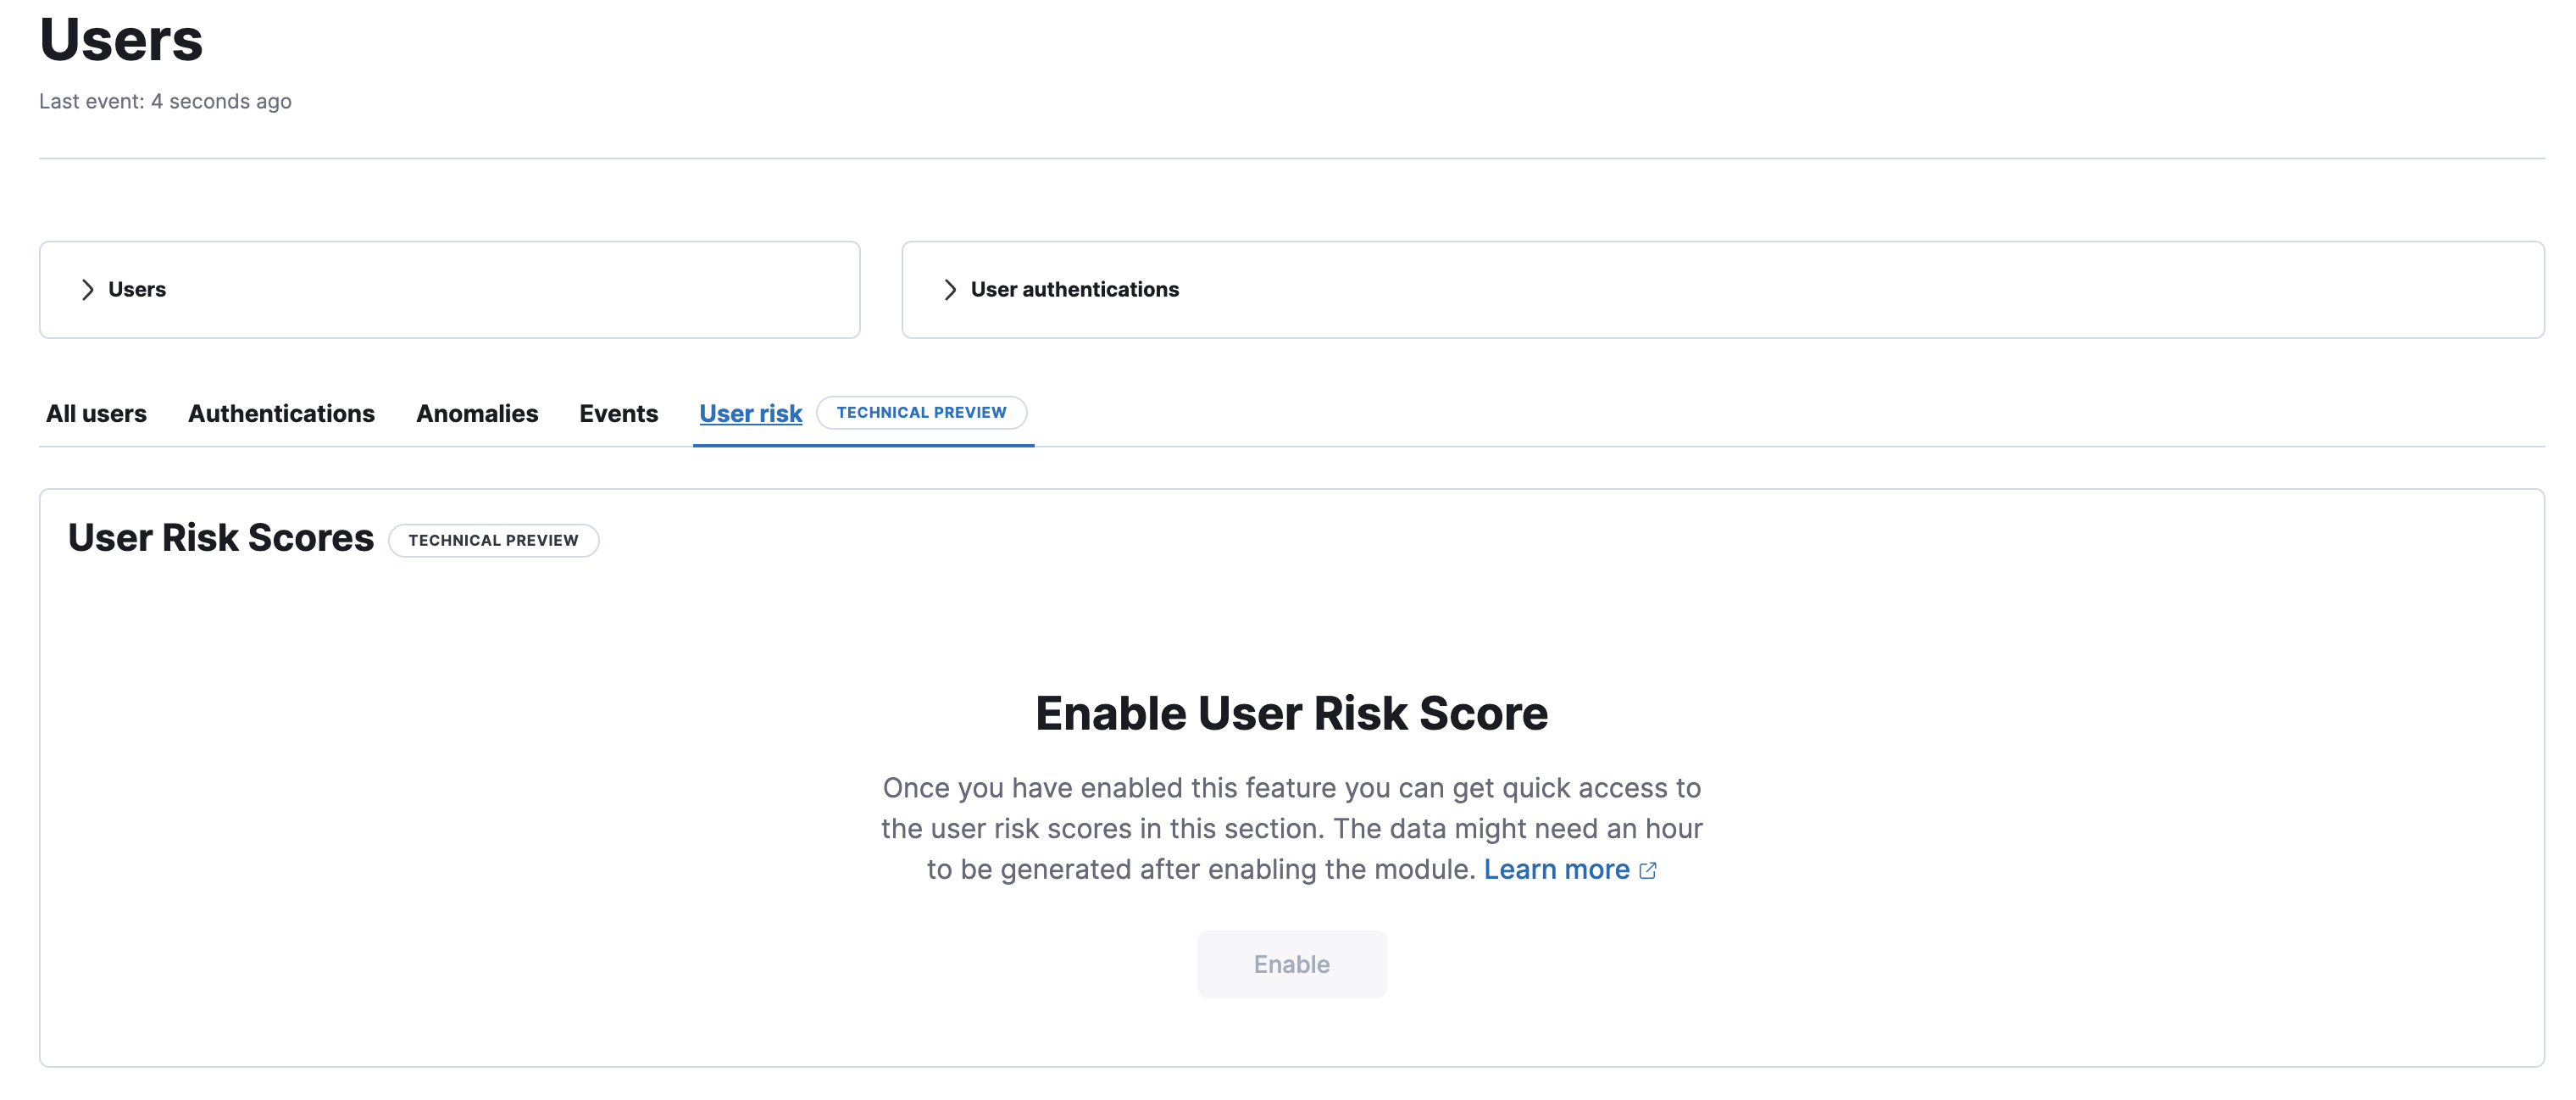
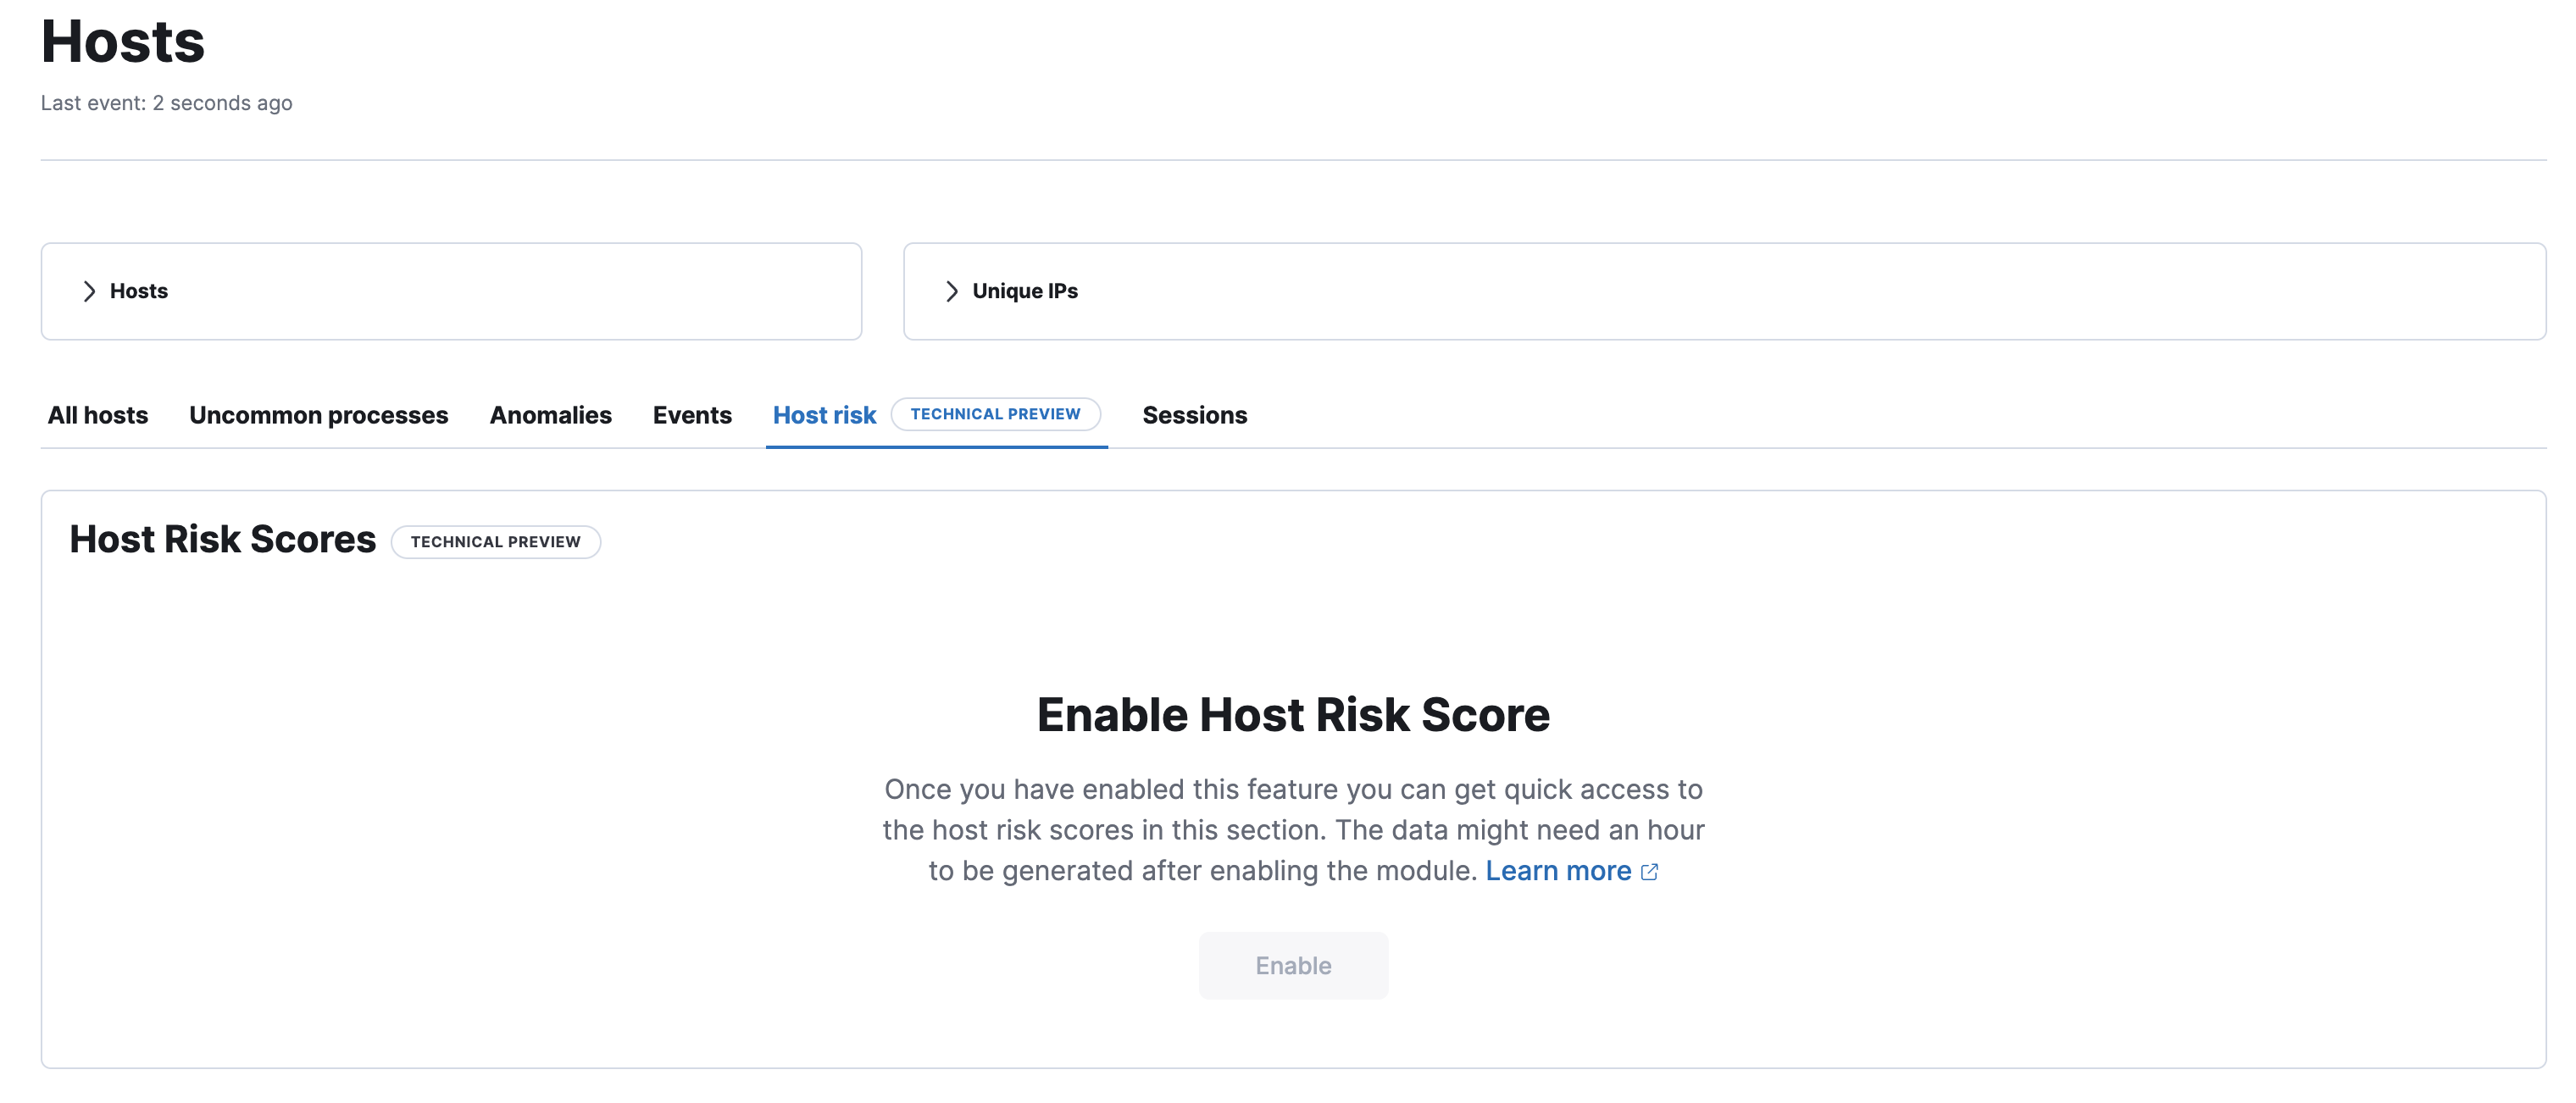
| . Select the *Host risk* tab, then click *Enable* to install the module. | ||
|
|
||
| [role="screenshot"] | ||
| image::images/enable-hrs.png[Enable Host Risk Score button] | ||
|
|
||
| To enable host risk score from a host's details page: | ||
|
|
||
| . Go to *Explore* -> *Hosts*. | ||
| . Select the *All hosts* tab, then click a host name. | ||
| . On the details page, scroll down to the data tables, then select the *Host risk* tab. | ||
| . Click *Enable* to install the module. | ||
|
|
||
| [role="screenshot"] | ||
| image::images/enable-hrs-details-pg.gif[Enable host risk score from the host's details page] | ||
|
|
||
| To enable host risk score from Console in {kib}, open a browser window and enter the following URL: | ||
|
|
||
| [source,console] | ||
| ---------------------------------- | ||
| {KibanaURL}/s/{spaceID}/app/dev_tools#/console?load_from={KibanaURL}/s/{spaceID}/internal/risk_score/prebuilt_content/dev_tool/enable_host_risk_score | ||
| ---------------------------------- | ||
|
|
||
| NOTE: If there's existing content in Console, scroll to the bottom to find the output loaded. | ||
|
|
||
| [[upgrade-host-risk-score]] | ||
| [discrete] | ||
| === Upgrade host risk score | ||
|
|
||
| If you previously enabled host risk score and are upgrading to {stack} version 8.5 or later, there'll be an **Upgrade** button for host risk score instead of **Enable**. | ||
|
|
||
| Before upgrading, note the following: | ||
|
|
||
| * Since older data is not preserved, previous host risk scores will be deleted, and new scores will be created. However, if you want to retain old host risk scores, you can reindex them _before_ upgrading. To learn how, refer to {ref}/docs-reindex.html[Reindex API]. New data will be stored in the `ml_host_risk_score_<space-id>` and `ml_host_risk_score_latest_<space-id>` indices. | ||
|
|
||
| * You must edit your {cloud}/ec-manage-kibana-settings.html#ec-manage-kibana-settings[{kib} user settings] and remove the `xpack.securitySolution.enableExperimental:['riskyHostsEnabled']` feature flag. | ||
SourinPaul marked this conversation as resolved.
Show resolved
Hide resolved
|
||
|
|
||
| After this is done, you can proceed with upgrading the host risk score feature from any of the following places in the {security-app}: | ||
|
|
||
| * The Entity Analytics dashboard | ||
|
Contributor
There was a problem hiding this comment. @angorayc @SourinPaul Same question as above- do we want upgrades to happen from multiple places? There was a problem hiding this comment. I think @machadoum has already removed the ability to enable risk scores from the
Member
There was a problem hiding this comment. In 8.5, we introduced an empty table state that allows users to Enable/Upgrade. It is displayed on Entity Analytics, Host, and User page and gives more opportunities for the user to engage with the Risk Score feature.
Contributor
There was a problem hiding this comment. If I understand it correctly, the issue above is to remove the callout banner, so users are still be able to enable / upgrade risk score from multiple pages in 8.5 |
||
| * The *Host risk* tab on the Hosts page | ||
| * The *Host risk* tab on a host's details page | ||
|
|
||
| NOTE: After you enable or upgrade host risk score, you might get a message that says, "No host risk score data available to display." To verify that the transform that installs the host risk score module is picking up data, refer to <<verify-host-risk-score, Verify that host risk score data installed successfully>>. | ||
|
|
||
| [[analyze-host-risk-score]] | ||
| [discrete] | ||
| === Analyze host risk score data | ||
|
|
||
| It is recommended you analyze hosts with the highest risk scores first -- those in the `Critical` and `Moderate` categories. Host risk score data appears in the following places in the {security-app}: | ||
|
|
||
| The `host.risk.calculated_level` column in the Alerts table: | ||
|
|
||
| [role="screenshot"] | ||
| image::images/hrs-alerts-table.png[Host risk score in the Alerts table] | ||
|
|
||
| The *Overview* tab on the Alert details flyout: | ||
|
|
||
| [role="screenshot"] | ||
| image::images/score-in-flyout.png[Host risk score in Alert details flyout] | ||
|
|
||
| The *Host risk classification* column in the All hosts table on the Hosts page: | ||
|
|
||
| [role="screenshot"] | ||
| image::images/hrs-all-hosts.png[Host risk score on the Hosts page] | ||
|
|
||
| The *Host risk* tab on the Hosts page: | ||
|
|
||
| [role="screenshot"] | ||
| image::images/hosts-by-risk-tab.png[Host risk score on the host details page] | ||
|
|
||
| The Overview section on the host details page: | ||
|
|
||
| [role="screenshot"] | ||
| image::images/hrs-overview-section.png[Host risk score in Overview section] | ||
|
|
||
| The *Host risk* tab on the host details page: | ||
|
|
||
| [role="screenshot"] | ||
| image::images/hosts-by-risk-details-page.png[Host risk score on the Hosts risk tab] | ||
|
|
||
| You can also visualize host risk score data using prebuilt dashboards that are automatically imported when the feature is enabled. | ||
|
|
||
| To access the dashboards: | ||
|
|
||
| . In {kib}, go to *Analytics* -> *Dashboard*, then search for `risk score`. | ||
| . Select *Drilldown of Host Risk Score* to analyze the risk components of a host, or *Current Risk Score for Hosts* to display a list of current risky hosts in your environment. | ||
|
|
||
| [role="screenshot"] | ||
| image::images/select-hrs-dashboard.png[Select host risk score dashboard] | ||
|
|
||
| In this example, we'll explore the *Drilldown of Host Risk Score* dashboard. | ||
|
|
||
| [role="screenshot"] | ||
| image::images/full-dashboard.png[Shows dashboard] | ||
|
|
||
| Use the histogram to track how the risk score for a particular host has changed over time. To specify a date range, use the date and time picker, or drag and select a time range within the histogram. | ||
jmikell821 marked this conversation as resolved.
Show resolved
Hide resolved
|
||
|
|
||
| [role="screenshot"] | ||
| image::images/histogram.png[] | ||
|
|
||
| To go to the host's details page, click any host's corresponding bar in the histogram, then select *Go to Host View*. | ||
|
|
||
| [role="screenshot"] | ||
| image::images/go-to-host-view.png[] | ||
|
|
||
| The histogram shows historical changes in a particular host's risk score(s). To specify a date range, use the date and time picker, or drag and select a time range within the histogram. | ||
|
|
||
| [role="screenshot"] | ||
| image::images/data-tables.png[] | ||
|
|
||
| [[verify-host-risk-score]] | ||
| === Verify that host risk score data installed successfully (Optional) | ||
|
|
||
| After you enable or upgrade host risk score, the following message may appear: | ||
|
|
||
| [role="screenshot"] | ||
| image::images/restart-hrs.png[Restart host risk score] | ||
|
|
||
| If so, click *Restart* and allow at least an hour for the data to be generated. If data still doesn't appear, verify that host risk score data has been generated: | ||
|
|
||
| In {kib}, run the following commands in Console to query the `ml_host_risk_score_<space-id>` index: | ||
|
|
||
| [source,console] | ||
| ---------------------------------- | ||
| GET ml_host_risk_score_<space-id>/_search | ||
jmikell821 marked this conversation as resolved.
Show resolved
Hide resolved
|
||
| ---------------------------------- | ||
|
|
||
| If no data returns, you'll need to check if the alerts index (.`alerts-security.alerts-<space-id>`) had alert data when `ml_hostriskscore_pivot_transform_<space-id>` was started. | ||
|
|
||
| Example: | ||
|
|
||
jmikell821 marked this conversation as resolved.
Show resolved
Hide resolved
|
||
| [source,console] | ||
| ---------------------------------- | ||
| GET transform/ml_hostriskscore_pivot_transform_<space-id>/_stats?human=true | ||
| ---------------------------------- | ||
|
|
||
| Here's an example response: | ||
|
|
||
| [source,console] | ||
| ---------------------------------- | ||
| { | ||
| "count": 1, | ||
| "transforms": [ | ||
| { | ||
| "id": "ml_hostriskscore_pivot_transform_<space-id>", | ||
jmikell821 marked this conversation as resolved.
Show resolved
Hide resolved
|
||
| "state": "started", | ||
| "node": { | ||
| "id": "H1tlwfTyRkWls-C0sarmHw", | ||
| "name": "instance-0000000000", | ||
| "ephemeral_id": "SBqlp5ywRuuop2gtcdCljA", | ||
| "transport_address": "10.43.255.164:19635", | ||
| "attributes": {} | ||
| }, | ||
| "stats": { | ||
| "pages_processed": 29, | ||
| "documents_processed": 11805, | ||
| "documents_indexed": 8, | ||
| "documents_deleted": 0, | ||
| "trigger_count": 9, | ||
| "index_time_in_ms": 52, | ||
| "index_total": 7, | ||
| "index_failures": 0, | ||
| "search_time_in_ms": 201, | ||
| "search_total": 29, | ||
| "search_failures": 0, | ||
| "processing_time_in_ms": 14, | ||
| "processing_total": 29, | ||
| "delete_time_in_ms": 0, | ||
| "exponential_avg_checkpoint_duration_ms": 59.02353261024906, | ||
| "exponential_avg_documents_indexed": 0.8762710605864747, | ||
| "exponential_avg_documents_processed": 1664.7724779548555 | ||
| }, | ||
| "checkpointing": { | ||
| "last": { | ||
| "checkpoint": 8, | ||
| "timestamp": "2022-10-17T14:49:50.315Z", | ||
| "timestamp_millis": 1666018190315, | ||
| "time_upper_bound": "2022-10-17T14:47:50.315Z", | ||
| "time_upper_bound_millis": 1666018070315 | ||
| }, | ||
| "operations_behind": 380, | ||
| "changes_last_detected_at_string": "2022-10-17T14:49:50.113Z", | ||
| "changes_last_detected_at": 1666018190113, | ||
| "last_search_time_string": "2022-10-17T14:49:50.113Z", | ||
| "last_search_time": 1666018190113 | ||
| } | ||
| } | ||
| ] | ||
| } | ||
| ---------------------------------- | ||
|
|
||
| Take note of the value from `time_upper_bound_millis` and enter it as a range query for the alerts index. | ||
|
|
||
| Example: | ||
|
|
||
| [source,console] | ||
| ---------------------------------- | ||
| GET .alerts-security.alerts-<space-id>/_search | ||
| { | ||
| "query": { | ||
| "range": { | ||
| "@timestamp": { | ||
| "lt": 1666018070315 | ||
| } | ||
| } | ||
| } | ||
| } | ||
| ---------------------------------- | ||
|
|
||
| If there's no response, verify that relevant <<rules-ui-management, rules>> are running and that alert data is being generated. If there is a response, click *Restart* and allow an hour for the host risk data to appear. | ||
There was a problem hiding this comment.
Choose a reason for hiding this comment
The reason will be displayed to describe this comment to others. Learn more.
@angorayc @SourinPaul Do we want to have multiple places for users to enable host risk score? I was under the impression that we were switching over to only enabling via the centralized EA page starting 8.6.
Uh oh!
There was an error while loading. Please reload this page.
There was a problem hiding this comment.
Choose a reason for hiding this comment
The reason will be displayed to describe this comment to others. Learn more.
We share the same UI of enabling / upgrading across all the pages, so it's true that in 8.5 users can enable risk score from multiple pages.