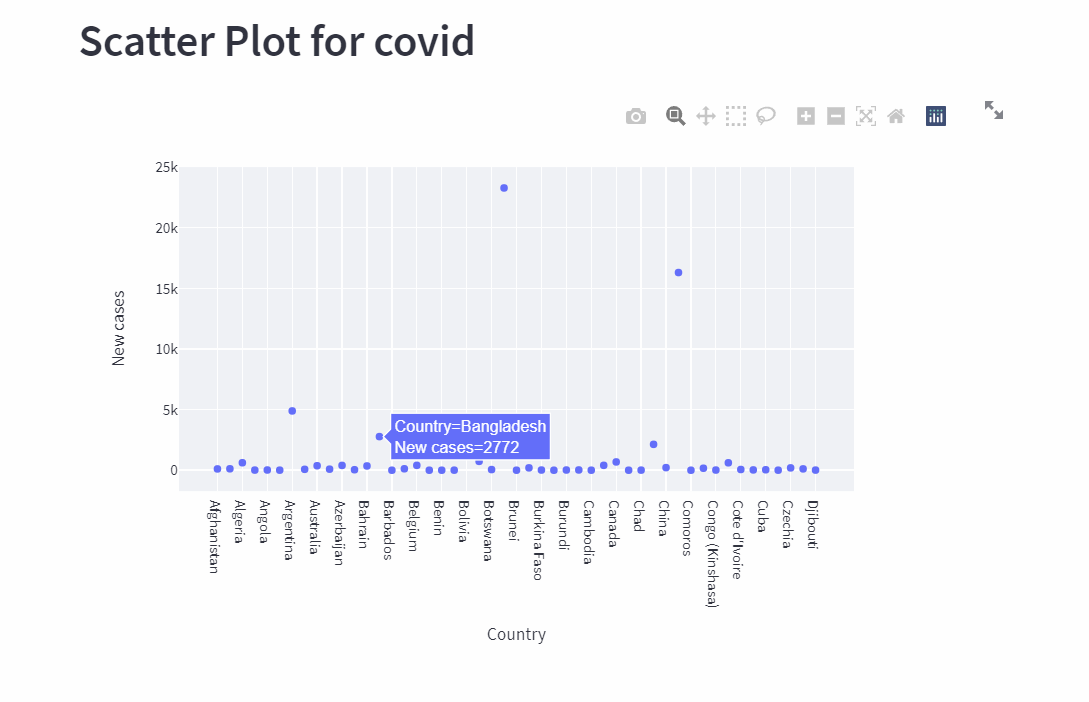
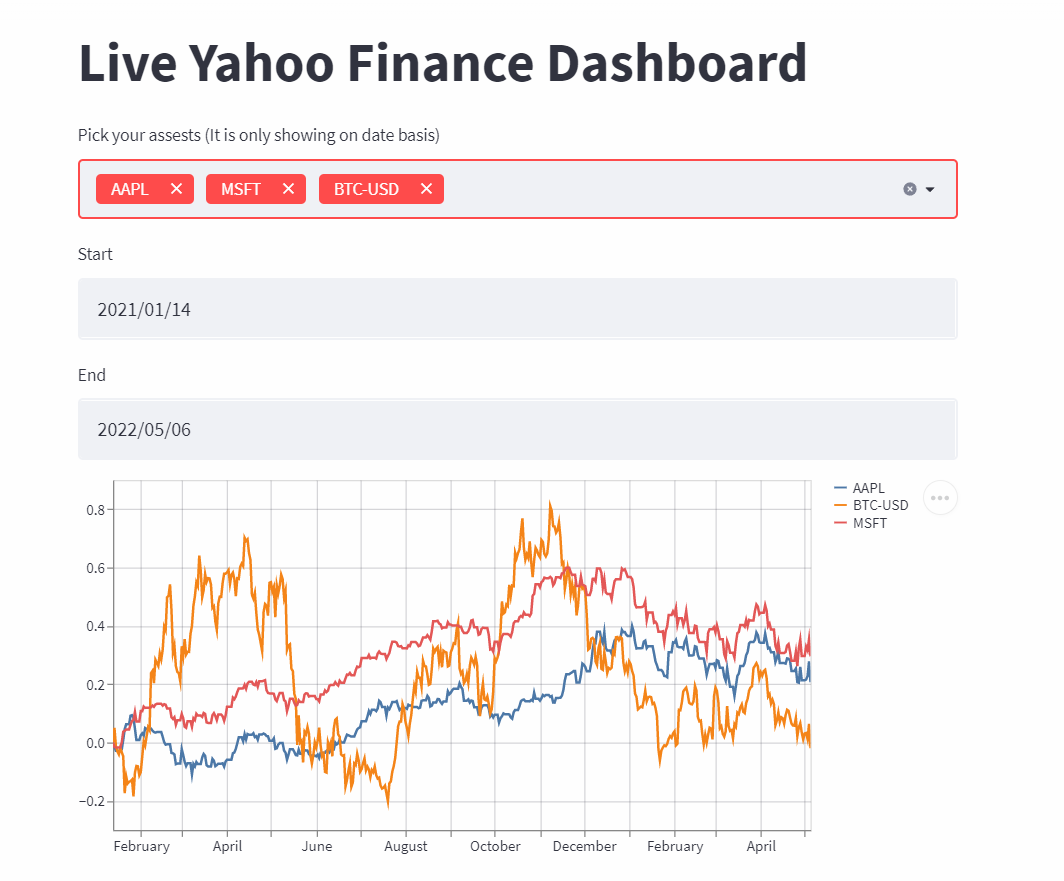
A web application of data visualization using streamlit.
Data Visualization: Data visualization is nothing just the representation of data through use of common graphics such as plots, info graphics and even animation.
It’s technology, however, that truly lit the fire under data visualization. Computers made it possible to process large amounts of data at lightning-fast speeds. Today, data visualization has become a rapidly evolving blend of science and art that is certain to change the corporate landscape over the next few years.
🤙Information related:
My channel link: https://youtu.be/-e0UNrOJRi8
For more information just scan the code.
