FossDash: Deploy and Configure
FossDash is a Grafana based dashboard for you FOSSology usage and system metrics.
It was partly developped by @darshank15 as part of the 2020 GSoC.
It is two-fold:
- FOSSology: regularly exports usage and system metrics to an external database
- FossDash: A pre-configured InfluxDB + Grafana solution collects, stores and displays graphs
Moreover, you may also:
- export FOSSology metrics to any other InfluxDB compatible service
- integrate multiple FOSSology instances, and/or combine any other kind of data from other services
This guide will walk you through Docker deployment and configuration of the FossDash service:
- Deploy FOSSology
- Configure and deploy FossDash
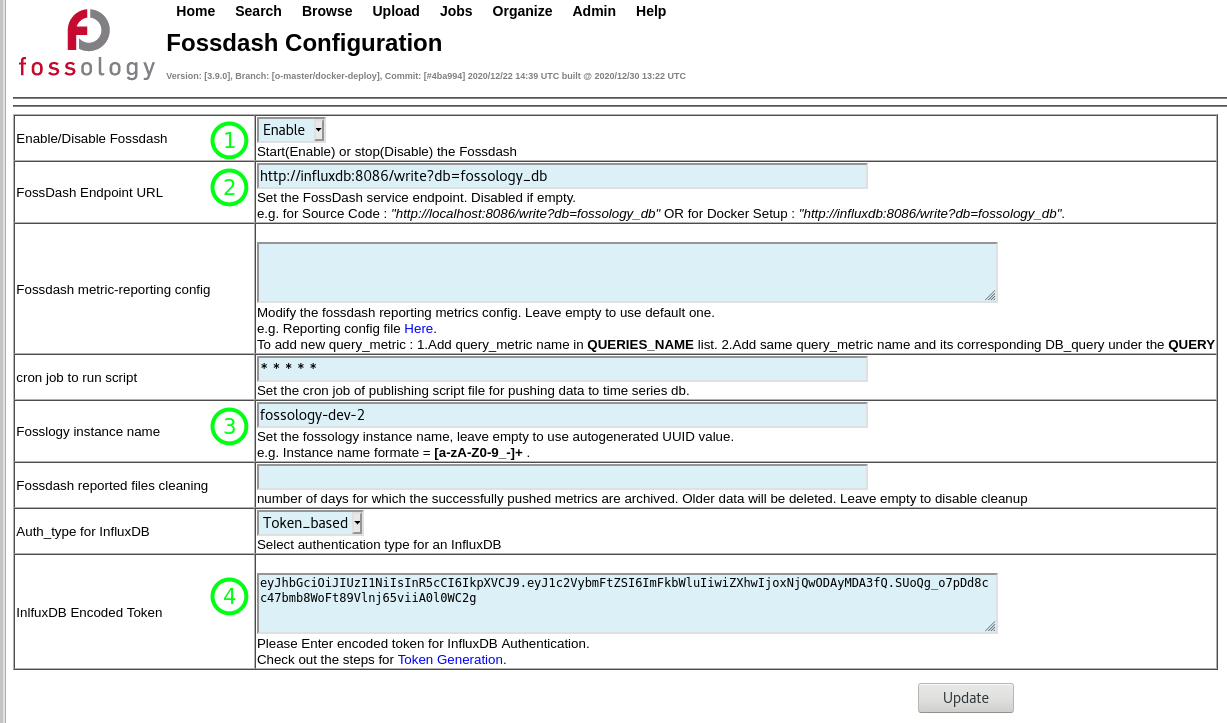
- Configure FossDash on FOSSology
The minimum version of FOSSology is 3.10 <- UPDATE
Deploy Fossology as usual, and make sure the Admin->Fossdash menu entry is available

In the basic setup below, FossDash is expected to run on the same server as Fossology.
- Clone the FossDash repository: https://github.com/Orange-OpenSource/fossdash <- MOVE and UPDATE ?
- Configure the
.envfile as appropriate (TODO addINFLUXDB_HTTP_SHARED_SECRETvariable)
The docker-copose.yml file will run 3 containers:
-
grafana: to build and show graphs -
influxdb: to collect and store the metrics -
apache-reverse-proxy: to access separately the Grafana and InfluxDB web pages on a single port.- View the dashboard at: https://my-server/fossdash
- Push metrics to https://my-server/influxdb/write?db=fossology_db
- May also be used to configure an SSL layer.
The Docker network fossology_default is shared with the Fossology containers.
Run: docker-compose -p fossdash up
The details to configure FossDash in Fossology can be found here: https://github.com/darshank15/GSoC_2020_FOSSOlogy/wiki/Fossdash-setup---Getting-started#fossdash-install-fossology-and-configure-the-fossdash
TODO: Move the Doc, and update the Token Generation link in the Fossology configuration page
Browse to http://localhost:8080/grafana In the Dashboards management page, two default dashboards are provided:
- one global to all Fossology instances reporting to this FossDash service
- another that will report data specifically for a selected instance
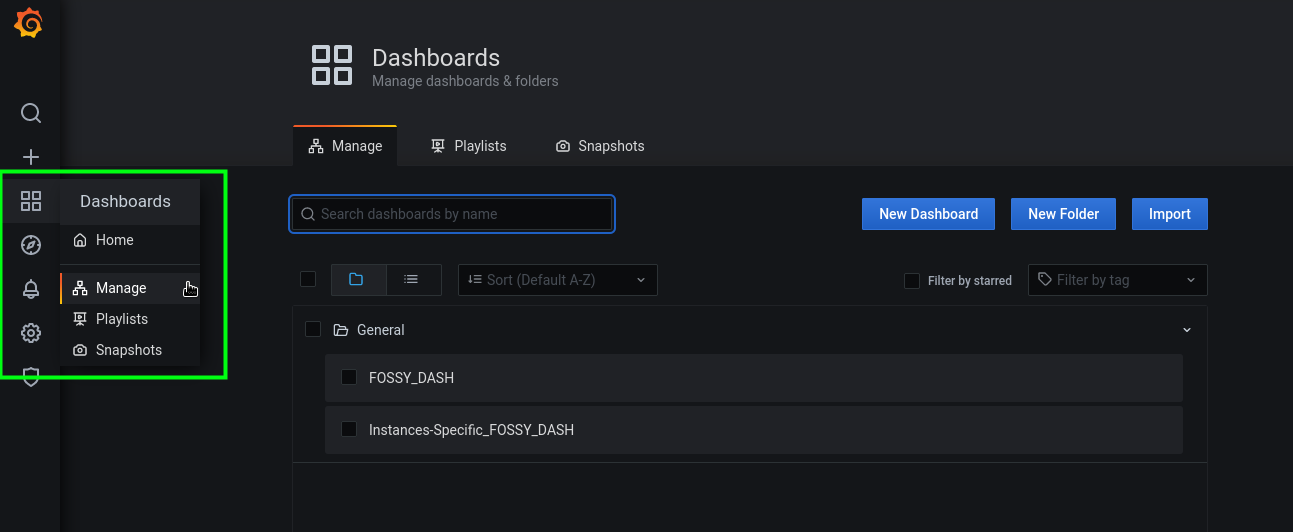
Example for Instance specific dashboard:
