A MATLAB Data Analysis Application implemented for a large automotive manufacturer during the interview process.
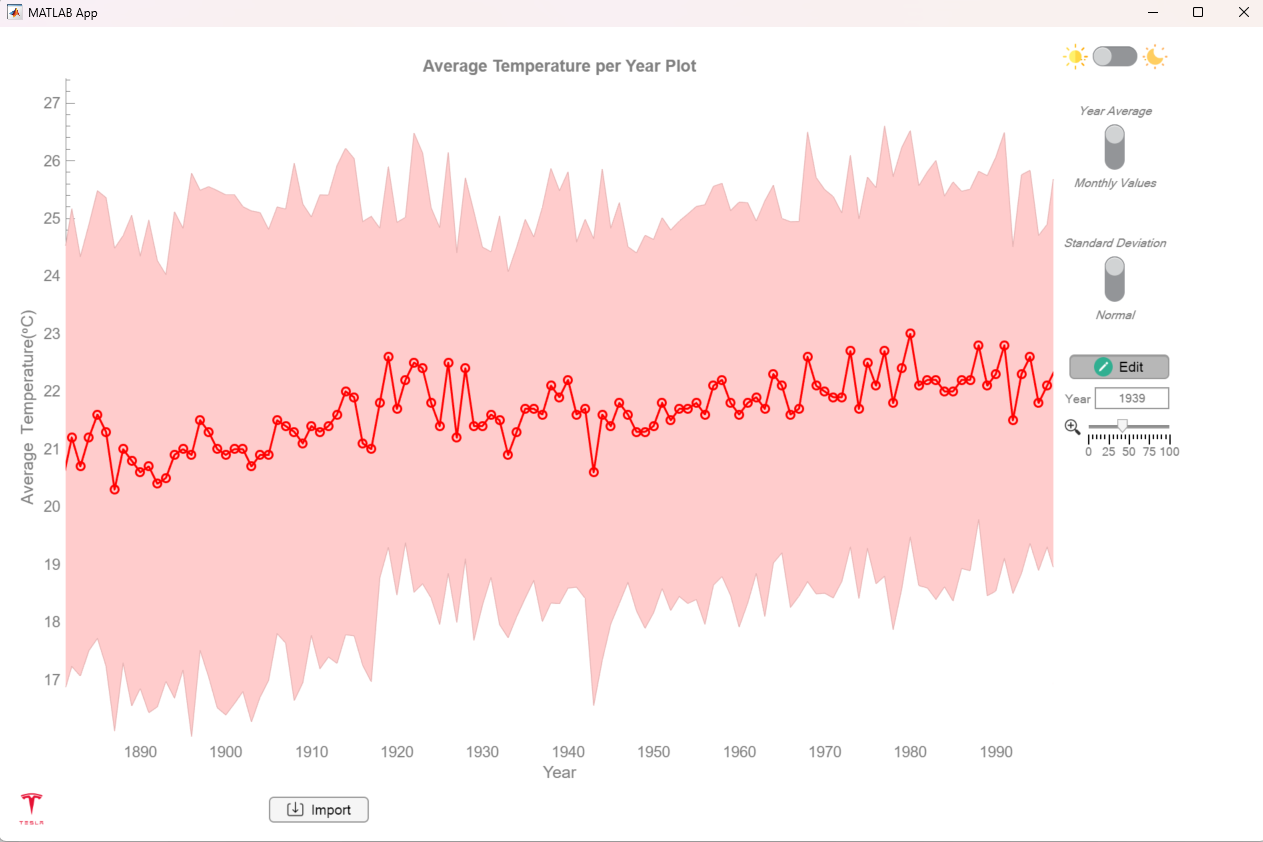
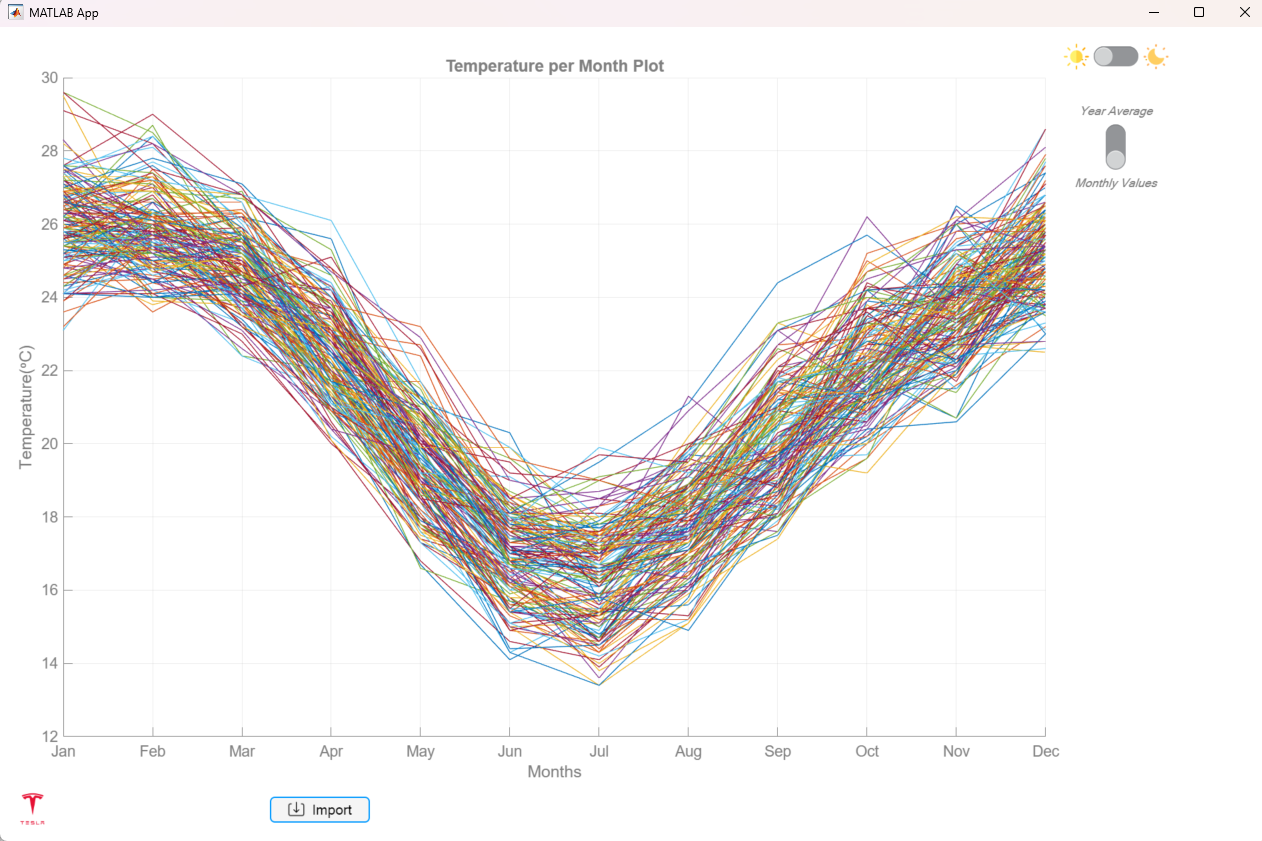
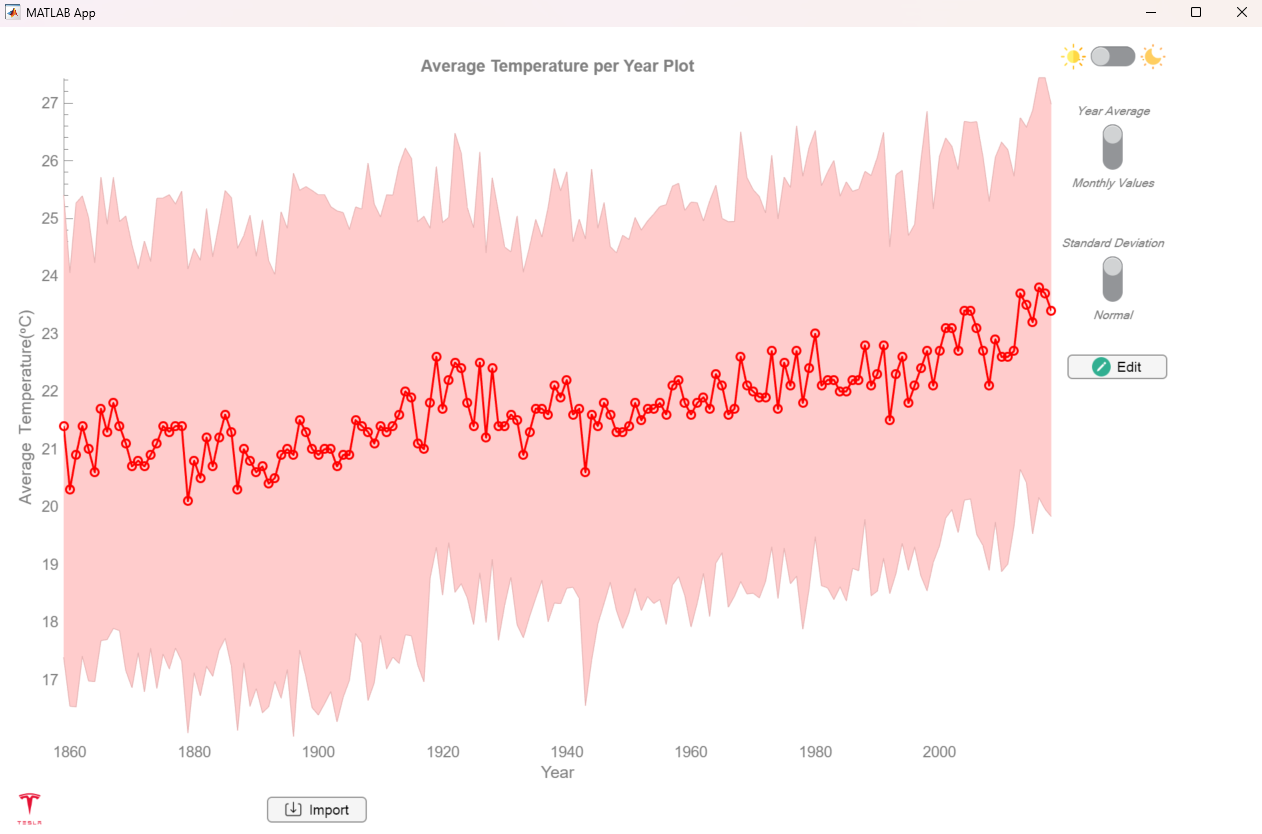
The application prompts the user to load a .csv dataset. Upon succesfully loading the UI plots data providing useful information and customization. With given dataset app shows all temperatures per month with the ability to:
- Group the temperature data by year averages, as opposed to monthly values
- Ability to overlay +-1σ (standard deviation)
- Ability to zoom around a center value, using custom MATLAB uicontrols and not the built-in zoom/pan interactions

© Giannis Kotsias | 2022 All rights reserved