Replies: 8 comments
-
|
I think your case may be caused by one of the following reasons:
You can check these issues through the consul web ui with the prometheus web ui. |
Beta Was this translation helpful? Give feedback.
-
|
@zhijian-pro |
Beta Was this translation helpful? Give feedback.
-
|
Please check the juicefs log for output related to this code.
Lines 69 to 133 in b08a7f6 |
Beta Was this translation helpful? Give feedback.
-
|
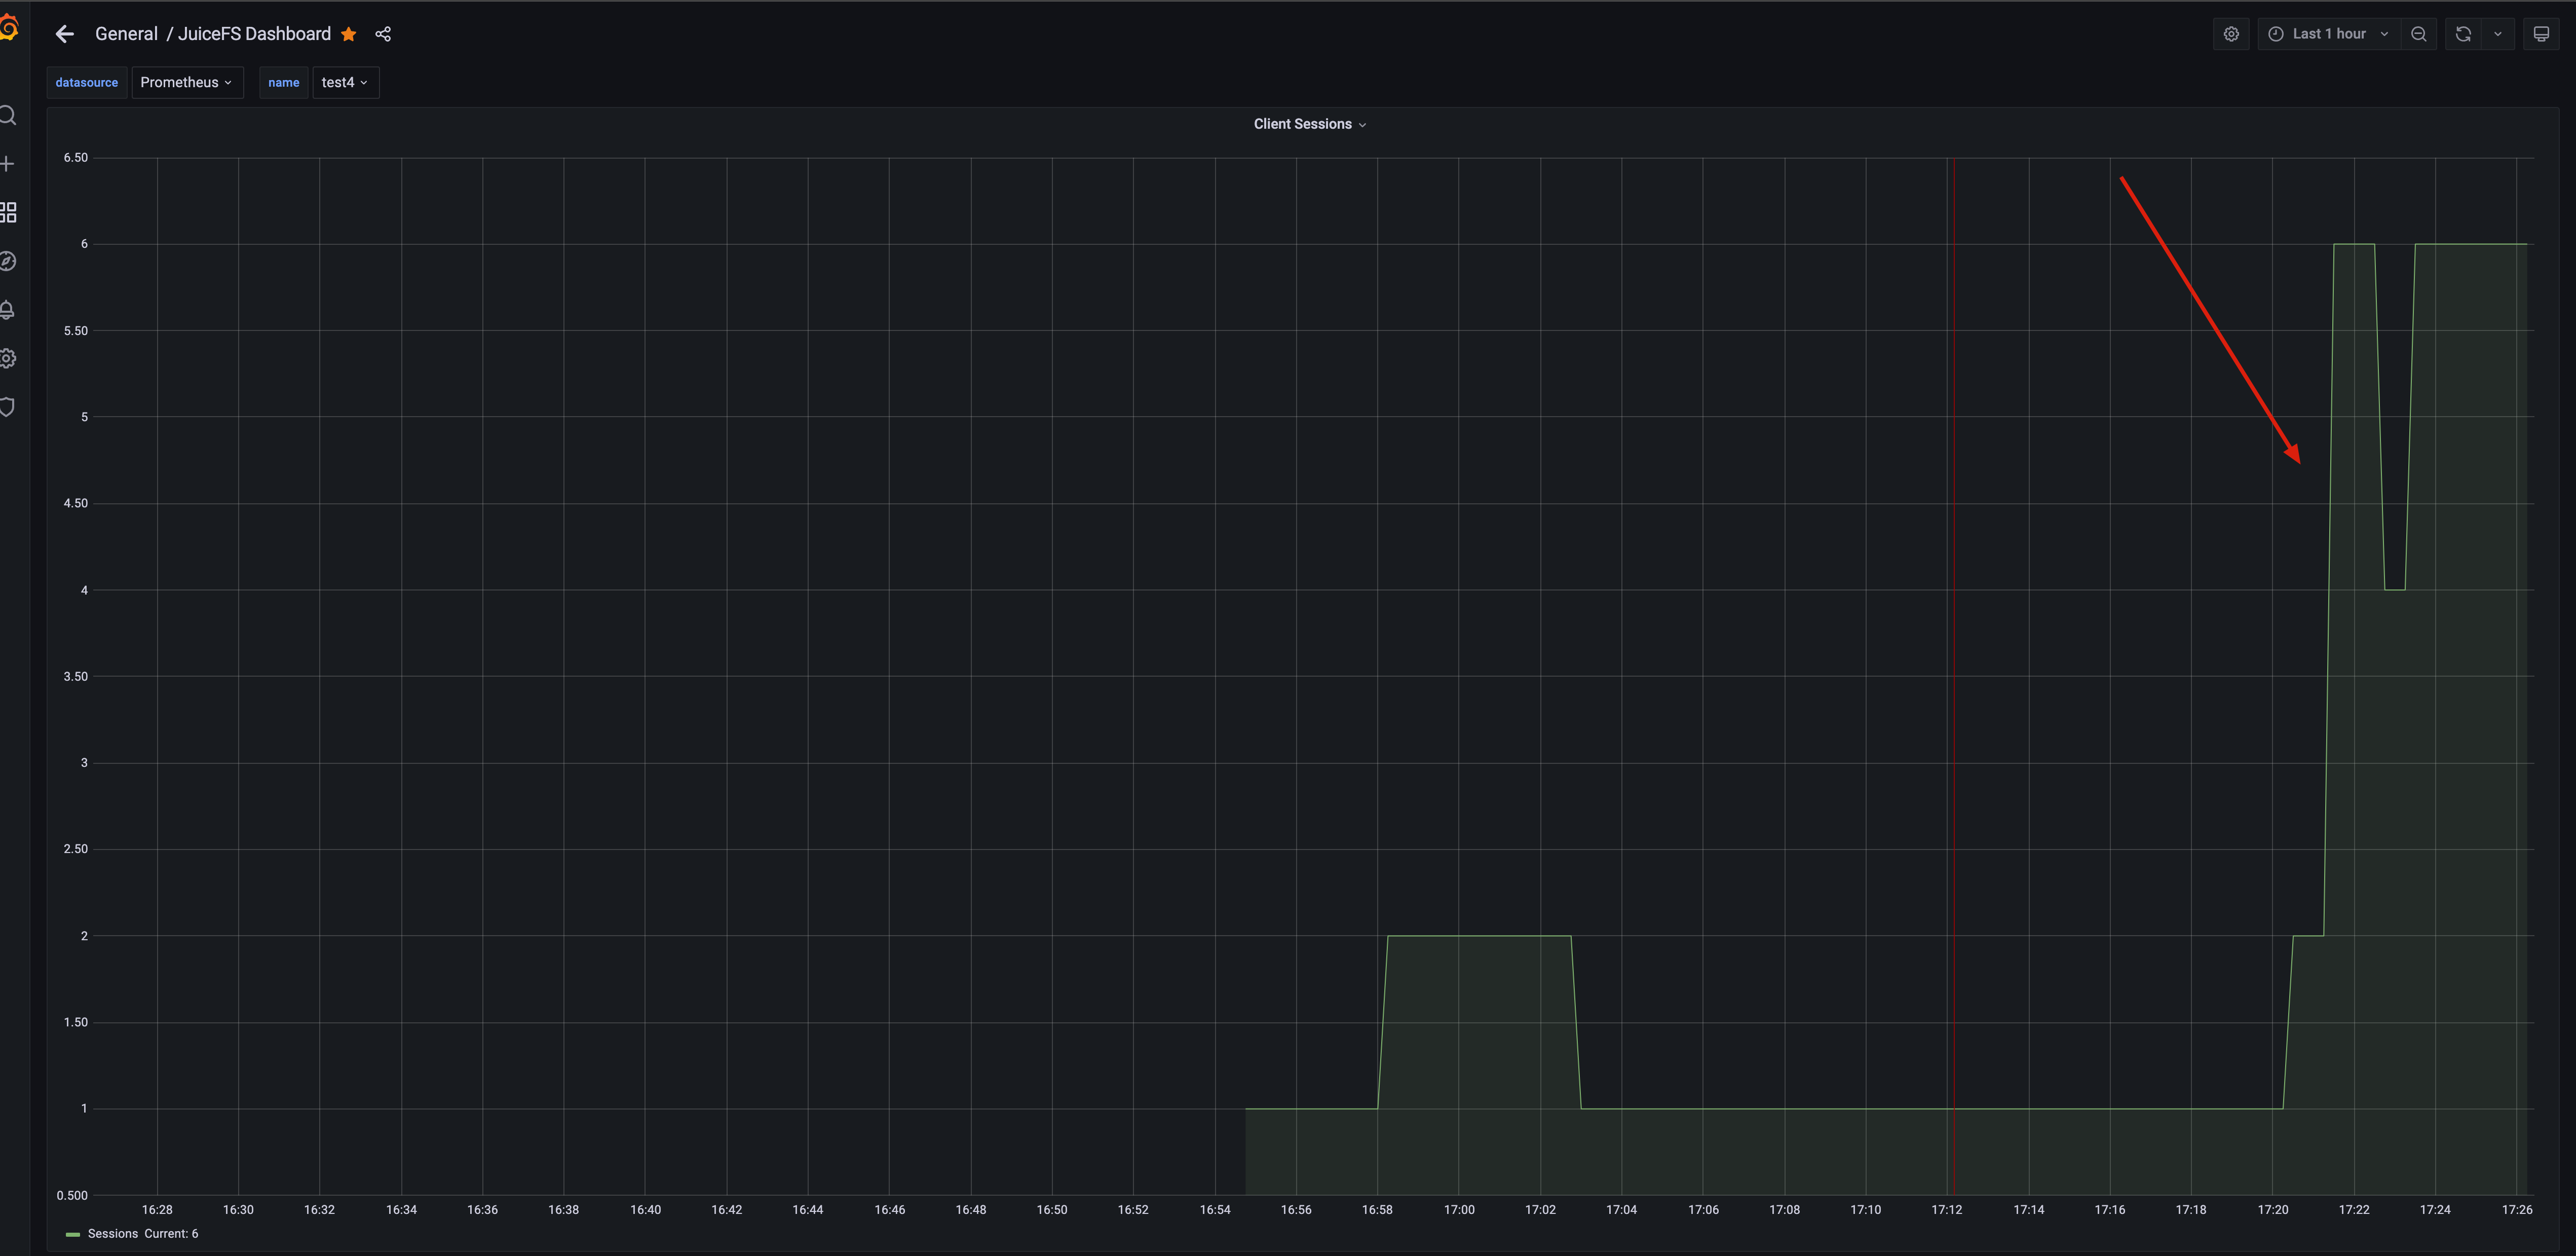
hello, i can see juicefs on node40 register to consul success. And the prometheus on node40 works well 2022/08/23 22:00:47.311807 juicefs[147255] <INFO>: Meta address: tikv://xxxxxxxxxxxxxxxxxxx [interface.go:402]
2022/08/23 22:00:47.322440 juicefs[147255] <INFO>: Data use minio://xxxxxxxxxxxxxxxxx/filesystem/filesystem/ [mount.go:422]
2022/08/23 22:00:47.322916 juicefs[147255] <INFO>: Disk cache (/var/jfsCache/e8e26dbe-9d54-4e6c-b95b-8c7f13a03ed5/): capacity (204800 MB), free ratio (10%), max pending pages (15) [disk_cache.go:93]
2022/08/23 22:00:47.375944 juicefs[147284] <INFO>: Meta address: tikv://xxxxxxxxxxxxxxx [interface.go:402]
2022/08/23 22:00:47.386215 juicefs[147284] <INFO>: Data use minio://xxxxxxxxxxxxx/filesystem/filesystem/ [mount.go:422]
2022/08/23 22:00:47.386576 juicefs[147284] <INFO>: Disk cache (/var/jfsCache/e8e26dbe-9d54-4e6c-b95b-8c7f13a03ed5/): capacity (204800 MB), free ratio (10%), max pending pages (15) [disk_cache.go:93]
2022/08/23 22:00:47.390740 juicefs[147284] <INFO>: Create session 41 OK with version: 1.0.0+2022-08-08.cf0c269 [base.go:266]
2022/08/23 22:00:47.391909 juicefs[147284] <INFO>: Prometheus metrics listening on xxxxxxxxxxxxx:9567 [mount.go:160]
2022/08/23 22:00:47.412083 juicefs[147284] <INFO>: Juicefs register to consul success [metrics.go:131]
2022/08/23 22:00:47.412258 juicefs[147284] <INFO>: Mounting volume filesystem at /data ... [mount_unix.go:181]
2022/08/23 22:54:48.742996 juicefs[147284] <INFO>: close session 41: %!s(<nil>) [base.go:333]
2022/08/23 23:40:46.543205 juicefs[120395] <INFO>: Meta address: tikv://xxxxxxxxxxxxx/file-meta?ca=/root/tikv-pki/tikv-pki/ca.crt&cert=/root/tikv-pki/tikv-pki/client.crt&key=/root/tikv-pki/tikv-pki/client.pem [interface.go:402]
2022/08/23 23:40:46.578521 juicefs[120395] <INFO>: Data use minio://xxxxxxxxxxxxx/filesystem/filesystem/ [mount.go:422]
2022/08/23 23:40:46.578793 juicefs[120395] <INFO>: Disk cache (/var/jfsCache/862a9a51-e3cd-49bc-ad30-240bc59e4cb5/): capacity (204800 MB), free ratio (10%), max pending pages (15) [disk_cache.go:93]
2022/08/23 23:40:46.623804 juicefs[120420] <INFO>: Meta address: tikv://xxxxxxxxxxxxx/file-meta?ca=/root/tikv-pki/tikv-pki/ca.crt&cert=/root/tikv-pki/tikv-pki/client.crt&key=/root/tikv-pki/tikv-pki/client.pem [interface.go:402]
2022/08/23 23:40:46.654918 juicefs[120420] <INFO>: Data use minio://xxxxxxxxxxxxx/filesystem/filesystem/ [mount.go:422]
2022/08/23 23:40:46.655155 juicefs[120420] <INFO>: Disk cache (/var/jfsCache/862a9a51-e3cd-49bc-ad30-240bc59e4cb5/): capacity (204800 MB), free ratio (10%), max pending pages (15) [disk_cache.go:93]
2022/08/23 23:40:46.659329 juicefs[120420] <INFO>: Create session 48 OK with version: 1.0.0+2022-08-08.cf0c269 [base.go:266]
2022/08/23 23:40:46.660709 juicefs[120420] <INFO>: Prometheus metrics listening on xxxxxxxxxxxxx:9567 [mount.go:160]
2022/08/23 23:40:46.689141 juicefs[120420] <INFO>: Juicefs register to consul success [metrics.go:131]
2022/08/23 23:40:46.689271 juicefs[120420] <INFO>: Mounting volume filesystem at /dataset ... [mount_unix.go:181]
2022/08/24 11:16:41.989787 juicefs[120420] <INFO>: close session 48: %!s(<nil>) [base.go:333]
2022/08/24 11:16:49.395371 juicefs[176360] <INFO>: Meta address: tikv://xxxxxxxxxxxxx/file-meta?ca=/root/tikv-pki/tikv-pki/ca.crt&cert=/root/tikv-pki/tikv-pki/client.crt&key=/root/tikv-pki/tikv-pki/client.pem [interface.go:402]
2022/08/24 11:16:49.422495 juicefs[176360] <INFO>: Data use minio://xxxxxxxxxxxxx/filesystem/filesystem/ [mount.go:422]
2022/08/24 11:16:49.422783 juicefs[176360] <INFO>: Disk cache (/var/jfsCache/862a9a51-e3cd-49bc-ad30-240bc59e4cb5/): capacity (204800 MB), free ratio (20%), max pending pages (15) [disk_cache.go:93]
2022/08/24 11:16:49.475674 juicefs[176388] <INFO>: Meta address: tikv://xxxxxxxxxxxxx/file-meta?ca=/root/tikv-pki/tikv-pki/ca.crt&cert=/root/tikv-pki/tikv-pki/client.crt&key=/root/tikv-pki/tikv-pki/client.pem [interface.go:402]
2022/08/24 11:16:49.504797 juicefs[176388] <INFO>: Data use minio://xxxxxxxxxxxxx/filesystem/filesystem/ [mount.go:422]
2022/08/24 11:16:49.505140 juicefs[176388] <INFO>: Disk cache (/var/jfsCache/862a9a51-e3cd-49bc-ad30-240bc59e4cb5/): capacity (204800 MB), free ratio (20%), max pending pages (15) [disk_cache.go:93]
2022/08/24 11:16:49.509359 juicefs[176388] <INFO>: Create session 118 OK with version: 1.0.0+2022-08-08.cf0c269 [base.go:266]
2022/08/24 11:16:49.510217 juicefs[176388] <INFO>: Prometheus metrics listening on xxxxxxxxxxxxx:9567 [mount.go:160]
2022/08/24 11:16:49.533455 juicefs[176388] <INFO>: Juicefs register to consul success [metrics.go:131]
2022/08/24 11:16:49.533534 juicefs[176388] <INFO>: Mounting volume filesystem at /dataset ... [mount_unix.go:181]
[2022/08/27 21:10:34.913 +08:00] [ERROR] [client.go:528] ["[pd] tso request is canceled due to timeout"] [dc-location=global] [error="[PD:client:ErrClientGetTSOTimeout]get TSO timeout"] [stack="github.com/tikv/pd/client.(*client).watchTSDeadline.func1\n\t/go/pkg/mod/github.com/tikv/pd/client@v0.0.0-20220216070739-26c668271201/client.go:528"]
{"level":"warn","ts":"2022-08-27T21:10:44.004+0800","logger":"etcd-client","caller":"v3@v3.5.2/retry_interceptor.go:62","msg":"retrying of unary invoker failed","target":"etcd-endpoints://0xc000818e00/xxxxxxxxxxxxx:12379","attempt":0,"error":"rpc error: code = DeadlineExceeded desc = context deadline exceeded"}
[2022/08/27 21:10:44.007 +08:00] [ERROR] [client.go:833] ["[pd] getTS error"] [dc-location=global] [stream-addr=https://xxxxxxxxxxxxx:12379] [error="[PD:client:ErrClientGetTSO]EOF: EOF"] [stack="github.com/tikv/pd/client.(*client).handleDispatcher\n\t/go/pkg/mod/github.com/tikv/pd/client@v0.0.0-20220216070739-26c668271201/client.go:833"]
{"level":"info","ts":"2022-08-27T21:10:44.010+0800","logger":"etcd-client","caller":"v3@v3.5.2/client.go:207","msg":"Auto sync endpoints failed.","error":"context deadline exceeded"}
[2022/08/27 21:10:45.015 +08:00] [WARN] [pd.go:152] ["get timestamp too slow"] ["cost time"=1.012579053s]
[2022/08/27 21:10:45.015 +08:00] [WARN] [pd.go:152] ["get timestamp too slow"] ["cost time"=621.803574ms]
[2022/08/27 21:10:45.015 +08:00] [WARN] [pd.go:152] ["get timestamp too slow"] ["cost time"=19.041982547s]
[2022/08/27 21:10:45.015 +08:00] [WARN] [pd.go:152] ["get timestamp too slow"] ["cost time"=1.006976358s]
[2022/08/27 21:10:45.015 +08:00] [WARN] [pd.go:152] ["get timestamp too slow"] ["cost time"=6.989352923s]
[2022/08/27 21:38:52.980 +08:00] [ERROR] [client.go:528] ["[pd] tso request is canceled due to timeout"] [dc-location=global] [error="[PD:client:ErrClientGetTSOTimeout]get TSO timeout"] [stack="github.com/tikv/pd/client.(*client).watchTSDeadline.func1\n\t/go/pkg/mod/github.com/tikv/pd/client@v0.0.0-20220216070739-26c668271201/client.go:528"]
[2022/08/27 21:38:55.607 +08:00] [ERROR] [base_client.go:144] ["[pd] failed updateMember"] [error="[PD:client:ErrClientGetLeader]get leader from [https://xxxxxxxxxxxxx:12379 https://xxxxxxxxxxxxx:12379 https://xxxxxxxxxxxxx:12379] error"] [stack="github.com/tikv/pd/client.(*baseClient).memberLoop\n\t/go/pkg/mod/github.com/tikv/pd/client@v0.0.0-20220216070739-26c668271201/base_client.go:144"]
[2022/08/27 21:38:52.995 +08:00] [ERROR] [client.go:833] ["[pd] getTS error"] [dc-location=global] [stream-addr=https://xxxxxxxxxxxxx:12379] [error="[PD:client:ErrClientGetTSO]rpc error: code = Canceled desc = context canceled: rpc error: code = Canceled desc = context canceled"] [stack="github.com/tikv/pd/client.(*client).handleDispatcher\n\t/go/pkg/mod/github.com/tikv/pd/client@v0.0.0-20220216070739-26c668271201/client.go:833"]
{"level":"warn","ts":"2022-08-27T21:40:06.926+0800","logger":"etcd-client","caller":"v3@v3.5.2/retry_interceptor.go:62","msg":"retrying of unary invoker failed","target":"etcd-endpoints://0xc000818e00/xxxxxxxxxxxxx:12379","attempt":0,"error":"rpc error: code = DeadlineExceeded desc = context deadline exceeded"}
[2022/08/27 21:40:06.928 +08:00] [ERROR] [region_cache.go:1954] ["loadStore from PD failed"] [id=1] [error="rpc error: code = DeadlineExceeded desc = context deadline exceeded"] [errorVerbose="rpc error: code = DeadlineExceeded desc = context deadline exceeded\ngithub.com/tikv/pd/client.(*client).GetStore\n\t/go/pkg/mod/github.com/tikv/pd/client@v0.0.0-20220216070739-26c668271201/client.go:1524\ngithub.com/tikv/client-go/v2/util.InterceptedPDClient.GetStore\n\t/go/pkg/mod/github.com/tikv/client-go/v2@v2.0.1/util/pd_interceptor.go:132\ngithub.com/tikv/client-go/v2/internal/locate.(*Store).reResolve\n\t/go/pkg/mod/github.com/tikv/client-go/v2@v2.0.1/internal/locate/region_cache.go:1944\ngithub.com/tikv/client-go/v2/internal/locate.(*RegionCache).checkAndResolve\n\t/go/pkg/mod/github.com/tikv/client-go/v2@v2.0.1/internal/locate/region_cache.go:453\ngithub.com/tikv/client-go/v2/internal/locate.(*RegionCache).asyncCheckAndResolveLoop\n\t/go/pkg/mod/github.com/tikv/client-go/v2@v2.0.1/internal/locate/region_cache.go:422\nruntime.goexit\n\t/usr/local/go/src/runtime/asm_amd64.s:1581"] [stack="github.com/tikv/client-go/v2/internal/locate.(*Store).reResolve\n\t/go/pkg/mod/github.com/tikv/client-go/v2@v2.0.1/internal/locate/region_cache.go:1954\ngithub.com/tikv/client-go/v2/internal/locate.(*RegionCache).checkAndResolve\n\t/go/pkg/mod/github.com/tikv/client-go/v2@v2.0.1/internal/locate/region_cache.go:453\ngithub.com/tikv/client-go/v2/internal/locate.(*RegionCache).asyncCheckAndResolveLoop\n\t/go/pkg/mod/github.com/tikv/client-go/v2@v2.0.1/internal/locate/region_cache.go:422"]
[2022/08/27 21:40:06.930 +08:00] [ERROR] [kv.go:243] ["fail to load safepoint from pd"] [error="context deadline exceeded"] [errorVerbose="context deadline exceeded\ngithub.com/tikv/client-go/v2/tikv.(*EtcdSafePointKV).Get\n\t/go/pkg/mod/github.com/tikv/client-go/v2@v2.0.1/tikv/safepoint.go:148\ngithub.com/tikv/client-go/v2/tikv.loadSafePoint\n\t/go/pkg/mod/github.com/tikv/client-go/v2@v2.0.1/tikv/safepoint.go:183\ngithub.com/tikv/client-go/v2/tikv.(*KVStore).runSafePointChecker\n\t/go/pkg/mod/github.com/tikv/client-go/v2@v2.0.1/tikv/kv.go:236\nruntime.goexit\n\t/usr/local/go/src/runtime/asm_amd64.s:1581"] [stack="github.com/tikv/client-go/v2/tikv.(*KVStore).runSafePointChecker\n\t/go/pkg/mod/github.com/tikv/client-go/v2@v2.0.1/tikv/kv.go:243"]
[2022/08/27 21:40:06.925 +08:00] [ERROR] [pd.go:236] ["updateTS error"] [txnScope=global] [error="rpc error: code = Canceled desc = context canceled"] [errorVerbose="rpc error: code = Canceled desc = context canceled\ngithub.com/tikv/pd/client.(*client).processTSORequests\n\t/go/pkg/mod/github.com/tikv/pd/client@v0.0.0-20220216070739-26c668271201/client.go:1067\ngithub.com/tikv/pd/client.(*client).handleDispatcher\n\t/go/pkg/mod/github.com/tikv/pd/client@v0.0.0-20220216070739-26c668271201/client.go:823\nruntime.goexit\n\t/usr/local/go/src/runtime/asm_amd64.s:1581\ngithub.com/tikv/pd/client.(*tsoRequest).Wait\n\t/go/pkg/mod/github.com/tikv/pd/client@v0.0.0-20220216070739-26c668271201/client.go:1283\ngithub.com/tikv/pd/client.(*client).GetTS\n\t/go/pkg/mod/github.com/tikv/pd/client@v0.0.0-20220216070739-26c668271201/client.go:1303\ngithub.com/tikv/client-go/v2/util.InterceptedPDClient.GetTS\n\t/go/pkg/mod/github.com/tikv/client-go/v2@v2.0.1/util/pd_interceptor.go:81\ngithub.com/tikv/client-go/v2/oracle/oracles.(*pdOracle).getTimestamp\n\t/go/pkg/mod/github.com/tikv/client-go/v2@v2.0.1/oracle/oracles/pd.go:143\ngithub.com/tikv/client-go/v2/oracle/oracles.(*pdOracle).updateTS.func1\n\t/go/pkg/mod/github.com/tikv/client-go/v2@v2.0.1/oracle/oracles/pd.go:234\nsync.(*Map).Range\n\t/usr/local/go/src/sync/map.go:346\ngithub.com/tikv/client-go/v2/oracle/oracles.(*pdOracle).updateTS\n\t/go/pkg/mod/github.com/tikv/client-go/v2@v2.0.1/oracle/oracles/pd.go:232\nruntime.goexit\n\t/usr/local/go/src/runtime/asm_amd64.s:1581\ngithub.com/tikv/client-go/v2/oracle/oracles.(*pdOracle).getTimestamp\n\t/go/pkg/mod/github.com/tikv/client-go/v2@v2.0.1/oracle/oracles/pd.go:148\ngithub.com/tikv/client-go/v2/oracle/oracles.(*pdOracle).updateTS.func1\n\t/go/pkg/mod/github.com/tikv/client-go/v2@v2.0.1/oracle/oracles/pd.go:234\nsync.(*Map).Range\n\t/usr/local/go/src/sync/map.go:346\ngithub.com/tikv/client-go/v2/oracle/oracles.(*pdOracle).updateTS\n\t/go/pkg/mod/github.com/tikv/client-go/v2@v2.0.1/oracle/oracles/pd.go:232\nruntime.goexit\n\t/usr/local/go/src/runtime/asm_amd64.s:1581"] [stack="github.com/tikv/client-go/v2/oracle/oracles.(*pdOracle).updateTS.func1\n\t/go/pkg/mod/github.com/tikv/client-go/v2@v2.0.1/oracle/oracles/pd.go:236\nsync.(*Map).Range\n\t/usr/local/go/src/sync/map.go:346\ngithub.com/tikv/client-go/v2/oracle/oracles.(*pdOracle).updateTS\n\t/go/pkg/mod/github.com/tikv/client-go/v2@v2.0.1/oracle/oracles/pd.go:232"]
[2022/08/27 21:40:06.931 +08:00] [ERROR] [error.go:289] ["encountered error"] [error="rpc error: code = DeadlineExceeded desc = context deadline exceeded"] [errorVerbose="rpc error: code = DeadlineExceeded desc = context deadline exceeded\ngithub.com/tikv/pd/client.(*client).GetStore\n\t/go/pkg/mod/github.com/tikv/pd/client@v0.0.0-20220216070739-26c668271201/client.go:1524\ngithub.com/tikv/client-go/v2/util.InterceptedPDClient.GetStore\n\t/go/pkg/mod/github.com/tikv/client-go/v2@v2.0.1/util/pd_interceptor.go:132\ngithub.com/tikv/client-go/v2/internal/locate.(*Store).reResolve\n\t/go/pkg/mod/github.com/tikv/client-go/v2@v2.0.1/internal/locate/region_cache.go:1944\ngithub.com/tikv/client-go/v2/internal/locate.(*RegionCache).checkAndResolve\n\t/go/pkg/mod/github.com/tikv/client-go/v2@v2.0.1/internal/locate/region_cache.go:453\ngithub.com/tikv/client-go/v2/internal/locate.(*RegionCache).asyncCheckAndResolveLoop\n\t/go/pkg/mod/github.com/tikv/client-go/v2@v2.0.1/internal/locate/region_cache.go:422\nruntime.goexit\n\t/usr/local/go/src/runtime/asm_amd64.s:1581"] [stack="github.com/tikv/client-go/v2/error.Log\n\t/go/pkg/mod/github.com/tikv/client-go/v2@v2.0.1/error/error.go:289\ngithub.com/tikv/client-go/v2/internal/locate.(*RegionCache).checkAndResolve\n\t/go/pkg/mod/github.com/tikv/client-go/v2@v2.0.1/internal/locate/region_cache.go:454\ngithub.com/tikv/client-go/v2/internal/locate.(*RegionCache).asyncCheckAndResolveLoop\n\t/go/pkg/mod/github.com/tikv/client-go/v2@v2.0.1/internal/locate/region_cache.go:422"] [stack="github.com/tikv/client-go/v2/error.Log\n\t/go/pkg/mod/github.com/tikv/client-go/v2@v2.0.1/error/error.go:289\ngithub.com/tikv/client-go/v2/internal/locate.(*RegionCache).checkAndResolve\n\t/go/pkg/mod/github.com/tikv/client-go/v2@v2.0.1/internal/locate/region_cache.go:454\ngithub.com/tikv/client-go/v2/internal/locate.(*RegionCache).asyncCheckAndResolveLoop\n\t/go/pkg/mod/github.com/tikv/client-go/v2@v2.0.1/internal/locate/region_cache.go:422"]
[2022/08/27 21:40:07.930 +08:00] [WARN] [pd.go:152] ["get timestamp too slow"] ["cost time"=1m14.936009376s]
[2022/08/27 21:40:07.931 +08:00] [WARN] [pd.go:152] ["get timestamp too slow"] ["cost time"=1m18.943304092s]
[2022/08/27 21:40:07.930 +08:00] [WARN] [pd.go:152] ["get timestamp too slow"] ["cost time"=1.004897904s]
[2022/08/27 21:40:07.930 +08:00] [WARN] [pd.go:152] ["get timestamp too slow"] ["cost time"=1.008016671s]
[2022/08/27 21:40:07.931 +08:00] [WARN] [pd.go:152] ["get timestamp too slow"] ["cost time"=1m22.017278956s]
[2022/08/27 21:40:07.930 +08:00] [WARN] [pd.go:152] ["get timestamp too slow"] ["cost time"=1m22.164466683s]
[2022/08/27 21:40:07.931 +08:00] [WARN] [pd.go:152] ["get timestamp too slow"] ["cost time"=1.000337262s]
[2022/08/27 21:40:07.930 +08:00] [WARN] [pd.go:152] ["get timestamp too slow"] ["cost time"=1m21.198338657s]
[2022/08/27 21:40:07.931 +08:00] [WARN] [pd.go:152] ["get timestamp too slow"] ["cost time"=864.522469ms]
[2022/08/27 21:40:07.930 +08:00] [WARN] [pd.go:152] ["get timestamp too slow"] ["cost time"=1.006830796s]
[2022/08/27 21:40:07.931 +08:00] [WARN] [pd.go:152] ["get timestamp too slow"] ["cost time"=854.596787ms]
{"level":"warn","ts":"2022-08-27T22:27:11.386+0800","logger":"etcd-client","caller":"v3@v3.5.2/retry_interceptor.go:62","msg":"retrying of unary invoker failed","target":"etcd-endpoints://0xc000818e00/xxxxxxxxxxxxx:12379","attempt":0,"error":"rpc error: code = Unavailable desc = keepalive ping failed to receive ACK within timeout"}
{"level":"warn","ts":"2022-08-27T22:27:16.779+0800","logger":"etcd-client","caller":"v3@v3.5.2/retry_interceptor.go:62","msg":"retrying of unary invoker failed","target":"etcd-endpoints://0xc000818e00/xxxxxxxxxxxxx:12379","attempt":1,"error":"rpc error: code = DeadlineExceeded desc = context deadline exceeded"}
[2022/08/27 22:27:16.784 +08:00] [ERROR] [kv.go:243] ["fail to load safepoint from pd"] [error="context deadline exceeded"] [errorVerbose="context deadline exceeded\ngithub.com/tikv/client-go/v2/tikv.(*EtcdSafePointKV).Get\n\t/go/pkg/mod/github.com/tikv/client-go/v2@v2.0.1/tikv/safepoint.go:148\ngithub.com/tikv/client-go/v2/tikv.loadSafePoint\n\t/go/pkg/mod/github.com/tikv/client-go/v2@v2.0.1/tikv/safepoint.go:183\ngithub.com/tikv/client-go/v2/tikv.(*KVStore).runSafePointChecker\n\t/go/pkg/mod/github.com/tikv/client-go/v2@v2.0.1/tikv/kv.go:236\nruntime.goexit\n\t/usr/local/go/src/runtime/asm_amd64.s:1581"] [stack="github.com/tikv/client-go/v2/tikv.(*KVStore).runSafePointChecker\n\t/go/pkg/mod/github.com/tikv/client-go/v2@v2.0.1/tikv/kv.go:243"]
[2022/08/27 22:27:16.855 +08:00] [WARN] [pd.go:152] ["get timestamp too slow"] ["cost time"=306.694912ms]
[2022/08/27 22:27:16.855 +08:00] [WARN] [pd.go:152] ["get timestamp too slow"] ["cost time"=1.854762414s]
[2022/08/27 22:27:16.854 +08:00] [WARN] [pd.go:152] ["get timestamp too slow"] ["cost time"=2.878203954s]
[2022/08/27 22:27:34.711 +08:00] [ERROR] [client.go:528] ["[pd] tso request is canceled due to timeout"] [dc-location=global] [error="[PD:client:ErrClientGetTSOTimeout]get TSO timeout"] [stack="github.com/tikv/pd/client.(*client).watchTSDeadline.func1\n\t/go/pkg/mod/github.com/tikv/pd/client@v0.0.0-20220216070739-26c668271201/client.go:528"]
[2022/08/27 22:27:34.722 +08:00] [ERROR] [client.go:833] ["[pd] getTS error"] [dc-location=global] [stream-addr=https://xxxxxxxxxxxxx:12379] [error="[PD:client:ErrClientGetTSO]rpc error: code = Canceled desc = context canceled: rpc error: code = Canceled desc = context canceled"] [stack="github.com/tikv/pd/client.(*client).handleDispatcher\n\t/go/pkg/mod/github.com/tikv/pd/client@v0.0.0-20220216070739-26c668271201/client.go:833"]
[2022/08/27 22:27:34.723 +08:00] [ERROR] [pd.go:236] ["updateTS error"] [txnScope=global] [error="rpc error: code = Canceled desc = context canceled"] [errorVerbose="rpc error: code = Canceled desc = context canceled\ngithub.com/tikv/pd/client.(*client).processTSORequests\n\t/go/pkg/mod/github.com/tikv/pd/client@v0.0.0-20220216070739-26c668271201/client.go:1067\ngithub.com/tikv/pd/client.(*client).handleDispatcher\n\t/go/pkg/mod/github.com/tikv/pd/client@v0.0.0-20220216070739-26c668271201/client.go:823\nruntime.goexit\n\t/usr/local/go/src/runtime/asm_amd64.s:1581\ngithub.com/tikv/pd/client.(*tsoRequest).Wait\n\t/go/pkg/mod/github.com/tikv/pd/client@v0.0.0-20220216070739-26c668271201/client.go:1283\ngithub.com/tikv/pd/client.(*client).GetTS\n\t/go/pkg/mod/github.com/tikv/pd/client@v0.0.0-20220216070739-26c668271201/client.go:1303\ngithub.com/tikv/client-go/v2/util.InterceptedPDClient.GetTS\n\t/go/pkg/mod/github.com/tikv/client-go/v2@v2.0.1/util/pd_interceptor.go:81\ngithub.com/tikv/client-go/v2/oracle/oracles.(*pdOracle).getTimestamp\n\t/go/pkg/mod/github.com/tikv/client-go/v2@v2.0.1/oracle/oracles/pd.go:143\ngithub.com/tikv/client-go/v2/oracle/oracles.(*pdOracle).updateTS.func1\n\t/go/pkg/mod/github.com/tikv/client-go/v2@v2.0.1/oracle/oracles/pd.go:234\nsync.(*Map).Range\n\t/usr/local/go/src/sync/map.go:346\ngithub.com/tikv/client-go/v2/oracle/oracles.(*pdOracle).updateTS\n\t/go/pkg/mod/github.com/tikv/client-go/v2@v2.0.1/oracle/oracles/pd.go:232\nruntime.goexit\n\t/usr/local/go/src/runtime/asm_amd64.s:1581\ngithub.com/tikv/client-go/v2/oracle/oracles.(*pdOracle).getTimestamp\n\t/go/pkg/mod/github.com/tikv/client-go/v2@v2.0.1/oracle/oracles/pd.go:148\ngithub.com/tikv/client-go/v2/oracle/oracles.(*pdOracle).updateTS.func1\n\t/go/pkg/mod/github.com/tikv/client-go/v2@v2.0.1/oracle/oracles/pd.go:234\nsync.(*Map).Range\n\t/usr/local/go/src/sync/map.go:346\ngithub.com/tikv/client-go/v2/oracle/oracles.(*pdOracle).updateTS\n\t/go/pkg/mod/github.com/tikv/client-go/v2@v2.0.1/oracle/oracles/pd.go:232\nruntime.goexit\n\t/usr/local/go/src/runtime/asm_amd64.s:1581"] [stack="github.com/tikv/client-go/v2/oracle/oracles.(*pdOracle).updateTS.func1\n\t/go/pkg/mod/github.com/tikv/client-go/v2@v2.0.1/oracle/oracles/pd.go:236\nsync.(*Map).Range\n\t/usr/local/go/src/sync/map.go:346\ngithub.com/tikv/client-go/v2/oracle/oracles.(*pdOracle).updateTS\n\t/go/pkg/mod/github.com/tikv/client-go/v2@v2.0.1/oracle/oracles/pd.go:232"]
[2022/08/27 22:27:35.730 +08:00] [WARN] [pd.go:152] ["get timestamp too slow"] ["cost time"=1.002443219s]
[2022/08/27 22:27:35.730 +08:00] [WARN] [pd.go:152] ["get timestamp too slow"] ["cost time"=2.51930045s]
[2022/08/27 22:27:35.730 +08:00] [WARN] [pd.go:152] ["get timestamp too slow"] ["cost time"=1.70476579s]
[2022/08/30 10:57:51.752 +08:00] [WARN] [pd.go:152] ["get timestamp too slow"] ["cost time"=265.189766ms]
[2022/08/30 10:57:59.878 +08:00] [ERROR] [client.go:528] ["[pd] tso request is canceled due to timeout"] [dc-location=global] [error="[PD:client:ErrClientGetTSOTimeout]get TSO timeout"] [stack="github.com/tikv/pd/client.(*client).watchTSDeadline.func1\n\t/go/pkg/mod/github.com/tikv/pd/client@v0.0.0-20220216070739-26c668271201/client.go:528"]
[2022/08/30 10:58:04.640 +08:00] [ERROR] [client.go:528] ["[pd] tso request is canceled due to timeout"] [dc-location=global] [error="[PD:client:ErrClientGetTSOTimeout]get TSO timeout"] [stack="github.com/tikv/pd/client.(*client).watchTSDeadline.func1\n\t/go/pkg/mod/github.com/tikv/pd/client@v0.0.0-20220216070739-26c668271201/client.go:528"]
{"level":"warn","ts":"2022-08-30T10:58:44.254+0800","logger":"etcd-client","caller":"v3@v3.5.2/retry_interceptor.go:62","msg":"retrying of unary invoker failed","target":"etcd-endpoints://0xc000818e00/xxxxxxxxxxxxx:12379","attempt":0,"error":"rpc error: code = DeadlineExceeded desc = context deadline exceeded"}
[2022/08/30 10:58:44.274 +08:00] [ERROR] [kv.go:243] ["fail to load safepoint from pd"] [error="context deadline exceeded"] [errorVerbose="context deadline exceeded\ngithub.com/tikv/client-go/v2/tikv.(*EtcdSafePointKV).Get\n\t/go/pkg/mod/github.com/tikv/client-go/v2@v2.0.1/tikv/safepoint.go:148\ngithub.com/tikv/client-go/v2/tikv.loadSafePoint\n\t/go/pkg/mod/github.com/tikv/client-go/v2@v2.0.1/tikv/safepoint.go:183\ngithub.com/tikv/client-go/v2/tikv.(*KVStore).runSafePointChecker\n\t/go/pkg/mod/github.com/tikv/client-go/v2@v2.0.1/tikv/kv.go:236\nruntime.goexit\n\t/usr/local/go/src/runtime/asm_amd64.s:1581"] [stack="github.com/tikv/client-go/v2/tikv.(*KVStore).runSafePointChecker\n\t/go/pkg/mod/github.com/tikv/client-go/v2@v2.0.1/tikv/kv.go:243"]
[2022/08/30 10:58:44.285 +08:00] [WARN] [pd.go:152] ["get timestamp too slow"] ["cost time"=51.637447846s]
[2022/08/30 10:58:46.300 +08:00] [WARN] [pd.go:152] ["get timestamp too slow"] ["cost time"=52.813473365s]
[2022/08/30 10:58:46.300 +08:00] [WARN] [pd.go:152] ["get timestamp too slow"] ["cost time"=2.011293792s]
[2022/08/30 10:58:46.300 +08:00] [WARN] [pd.go:152] ["get timestamp too slow"] ["cost time"=41.672839404s]
[2022/08/30 10:58:46.300 +08:00] [WARN] [pd.go:152] ["get timestamp too slow"] ["cost time"=2.162529248s]
[2022/08/30 10:58:46.300 +08:00] [WARN] [pd.go:152] ["get timestamp too slow"] ["cost time"=31.864284798s]
[2022/08/30 10:58:46.300 +08:00] [WARN] [pd.go:152] ["get timestamp too slow"] ["cost time"=1.291229006s]
[2022/08/30 10:58:46.300 +08:00] [WARN] [pd.go:152] ["get timestamp too slow"] ["cost time"=41.430375325s]
[2022/08/30 10:58:46.300 +08:00] [WARN] [pd.go:152] ["get timestamp too slow"] ["cost time"=1.141538802s]
[2022/08/30 10:58:46.300 +08:00] [WARN] [pd.go:152] ["get timestamp too slow"] ["cost time"=7.302066935s]
[2022/08/30 10:58:56.764 +08:00] [WARN] [pd.go:152] ["get timestamp too slow"] ["cost time"=2.416381976s]
[2022/08/30 10:59:41.108 +08:00] [ERROR] [client.go:528] ["[pd] tso request is canceled due to timeout"] [dc-location=global] [error="[PD:client:ErrClientGetTSOTimeout]get TSO timeout"] [stack="github.com/tikv/pd/client.(*client).watchTSDeadline.func1\n\t/go/pkg/mod/github.com/tikv/pd/client@v0.0.0-20220216070739-26c668271201/client.go:528"]
[2022/08/30 10:59:46.312 +08:00] [ERROR] [client.go:833] ["[pd] getTS error"] [dc-location=global] [stream-addr=https://xxxxxxxxxxxxx:12379] [error="[PD:client:ErrClientGetTSO]EOF: EOF"] [stack="github.com/tikv/pd/client.(*client).handleDispatcher\n\t/go/pkg/mod/github.com/tikv/pd/client@v0.0.0-20220216070739-26c668271201/client.go:833"]
[2022/08/30 10:59:47.323 +08:00] [WARN] [pd.go:152] ["get timestamp too slow"] ["cost time"=657.000769ms]
[2022/08/30 10:59:47.323 +08:00] [WARN] [pd.go:152] ["get timestamp too slow"] ["cost time"=1.130065599s]
[2022/08/30 10:59:47.323 +08:00] [WARN] [pd.go:152] ["get timestamp too slow"] ["cost time"=738.196998ms]
[2022/08/30 10:59:47.323 +08:00] [WARN] [pd.go:152] ["get timestamp too slow"] ["cost time"=1.130068373s]
[2022/08/30 10:59:47.323 +08:00] [WARN] [pd.go:152] ["get timestamp too slow"] ["cost time"=9.718448871s]
[2022/08/30 10:59:47.323 +08:00] [WARN] [pd.go:152] ["get timestamp too slow"] ["cost time"=9.836435848s]
[2022/08/30 11:00:08.488 +08:00] [ERROR] [client.go:528] ["[pd] tso request is canceled due to timeout"] [dc-location=global] [error="[PD:client:ErrClientGetTSOTimeout]get TSO timeout"] [stack="github.com/tikv/pd/client.(*client).watchTSDeadline.func1\n\t/go/pkg/mod/github.com/tikv/pd/client@v0.0.0-20220216070739-26c668271201/client.go:528"]
[2022/08/30 11:00:08.964 +08:00] [ERROR] [client.go:833] ["[pd] getTS error"] [dc-location=global] [stream-addr=https://xxxxxxxxxxxxx:12379] [error="[PD:client:ErrClientGetTSO]EOF: EOF"] [stack="github.com/tikv/pd/client.(*client).handleDispatcher\n\t/go/pkg/mod/github.com/tikv/pd/client@v0.0.0-20220216070739-26c668271201/client.go:833"]
[2022/08/30 11:00:08.966 +08:00] [ERROR] [pd.go:236] ["updateTS error"] [txnScope=global] [error=EOF] [errorVerbose="EOF\ngithub.com/tikv/pd/client.(*client).processTSORequests\n\t/go/pkg/mod/github.com/tikv/pd/client@v0.0.0-20220216070739-26c668271201/client.go:1060\ngithub.com/tikv/pd/client.(*client).handleDispatcher\n\t/go/pkg/mod/github.com/tikv/pd/client@v0.0.0-20220216070739-26c668271201/client.go:823\nruntime.goexit\n\t/usr/local/go/src/runtime/asm_amd64.s:1581\ngithub.com/tikv/pd/client.(*tsoRequest).Wait\n\t/go/pkg/mod/github.com/tikv/pd/client@v0.0.0-20220216070739-26c668271201/client.go:1283\ngithub.com/tikv/pd/client.(*client).GetTS\n\t/go/pkg/mod/github.com/tikv/pd/client@v0.0.0-20220216070739-26c668271201/client.go:1303\ngithub.com/tikv/client-go/v2/util.InterceptedPDClient.GetTS\n\t/go/pkg/mod/github.com/tikv/client-go/v2@v2.0.1/util/pd_interceptor.go:81\ngithub.com/tikv/client-go/v2/oracle/oracles.(*pdOracle).getTimestamp\n\t/go/pkg/mod/github.com/tikv/client-go/v2@v2.0.1/oracle/oracles/pd.go:143\ngithub.com/tikv/client-go/v2/oracle/oracles.(*pdOracle).updateTS.func1\n\t/go/pkg/mod/github.com/tikv/client-go/v2@v2.0.1/oracle/oracles/pd.go:234\nsync.(*Map).Range\n\t/usr/local/go/src/sync/map.go:346\ngithub.com/tikv/client-go/v2/oracle/oracles.(*pdOracle).updateTS\n\t/go/pkg/mod/github.com/tikv/client-go/v2@v2.0.1/oracle/oracles/pd.go:232\nruntime.goexit\n\t/usr/local/go/src/runtime/asm_amd64.s:1581\ngithub.com/tikv/client-go/v2/oracle/oracles.(*pdOracle).getTimestamp\n\t/go/pkg/mod/github.com/tikv/client-go/v2@v2.0.1/oracle/oracles/pd.go:148\ngithub.com/tikv/client-go/v2/oracle/oracles.(*pdOracle).updateTS.func1\n\t/go/pkg/mod/github.com/tikv/client-go/v2@v2.0.1/oracle/oracles/pd.go:234\nsync.(*Map).Range\n\t/usr/local/go/src/sync/map.go:346\ngithub.com/tikv/client-go/v2/oracle/oracles.(*pdOracle).updateTS\n\t/go/pkg/mod/github.com/tikv/client-go/v2@v2.0.1/oracle/oracles/pd.go:232\nruntime.goexit\n\t/usr/local/go/src/runtime/asm_amd64.s:1581"] [stack="github.com/tikv/client-go/v2/oracle/oracles.(*pdOracle).updateTS.func1\n\t/go/pkg/mod/github.com/tikv/client-go/v2@v2.0.1/oracle/oracles/pd.go:236\nsync.(*Map).Range\n\t/usr/local/go/src/sync/map.go:346\ngithub.com/tikv/client-go/v2/oracle/oracles.(*pdOracle).updateTS\n\t/go/pkg/mod/github.com/tikv/client-go/v2@v2.0.1/oracle/oracles/pd.go:232"]
[2022/08/30 11:00:09.967 +08:00] [WARN] [pd.go:152] ["get timestamp too slow"] ["cost time"=2.596116461s]
[2022/08/30 11:00:09.968 +08:00] [WARN] [pd.go:152] ["get timestamp too slow"] ["cost time"=998.010001ms]
[2022/08/30 11:00:11.575 +08:00] [WARN] [pd.go:152] ["get timestamp too slow"] ["cost time"=88.342147ms]
[2022/08/30 11:00:09.967 +08:00] [WARN] [pd.go:152] ["get timestamp too slow"] ["cost time"=3.559160721s]
[2022/08/30 11:00:18.190 +08:00] [WARN] [pd.go:152] ["get timestamp too slow"] ["cost time"=4.833695194s]
[2022/08/30 11:00:15.920 +08:00] [ERROR] [client.go:528] ["[pd] tso request is canceled due to timeout"] [dc-location=global] [error="[PD:client:ErrClientGetTSOTimeout]get TSO timeout"] [stack="github.com/tikv/pd/client.(*client).watchTSDeadline.func1\n\t/go/pkg/mod/github.com/tikv/pd/client@v0.0.0-20220216070739-26c668271201/client.go:528"]
[2022/08/30 11:00:26.006 +08:00] [ERROR] [client.go:528] ["[pd] tso request is canceled due to timeout"] [dc-location=global] [error="[PD:client:ErrClientGetTSOTimeout]get TSO timeout"] [stack="github.com/tikv/pd/client.(*client).watchTSDeadline.func1\n\t/go/pkg/mod/github.com/tikv/pd/client@v0.0.0-20220216070739-26c668271201/client.go:528"]
[2022/08/30 11:00:26.012 +08:00] [ERROR] [client.go:833] ["[pd] getTS error"] [dc-location=global] [stream-addr=https://xxxxxxxxxxxxx:12379] [error="[PD:client:ErrClientGetTSO]rpc error: code = Canceled desc = context canceled: rpc error: code = Canceled desc = context canceled"] [stack="github.com/tikv/pd/client.(*client).handleDispatcher\n\t/go/pkg/mod/github.com/tikv/pd/client@v0.0.0-20220216070739-26c668271201/client.go:833"]
[2022/08/30 11:00:26.018 +08:00] [ERROR] [pd.go:236] ["updateTS error"] [txnScope=global] [error="rpc error: code = Canceled desc = context canceled"] [errorVerbose="rpc error: code = Canceled desc = context canceled\ngithub.com/tikv/pd/client.(*client).processTSORequests\n\t/go/pkg/mod/github.com/tikv/pd/client@v0.0.0-20220216070739-26c668271201/client.go:1067\ngithub.com/tikv/pd/client.(*client).handleDispatcher\n\t/go/pkg/mod/github.com/tikv/pd/client@v0.0.0-20220216070739-26c668271201/client.go:823\nruntime.goexit\n\t/usr/local/go/src/runtime/asm_amd64.s:1581\ngithub.com/tikv/pd/client.(*tsoRequest).Wait\n\t/go/pkg/mod/github.com/tikv/pd/client@v0.0.0-20220216070739-26c668271201/client.go:1283\ngithub.com/tikv/pd/client.(*client).GetTS\n\t/go/pkg/mod/github.com/tikv/pd/client@v0.0.0-20220216070739-26c668271201/client.go:1303\ngithub.com/tikv/client-go/v2/util.InterceptedPDClient.GetTS\n\t/go/pkg/mod/github.com/tikv/client-go/v2@v2.0.1/util/pd_interceptor.go:81\ngithub.com/tikv/client-go/v2/oracle/oracles.(*pdOracle).getTimestamp\n\t/go/pkg/mod/github.com/tikv/client-go/v2@v2.0.1/oracle/oracles/pd.go:143\ngithub.com/tikv/client-go/v2/oracle/oracles.(*pdOracle).updateTS.func1\n\t/go/pkg/mod/github.com/tikv/client-go/v2@v2.0.1/oracle/oracles/pd.go:234\nsync.(*Map).Range\n\t/usr/local/go/src/sync/map.go:346\ngithub.com/tikv/client-go/v2/oracle/oracles.(*pdOracle).updateTS\n\t/go/pkg/mod/github.com/tikv/client-go/v2@v2.0.1/oracle/oracles/pd.go:232\nruntime.goexit\n\t/usr/local/go/src/runtime/asm_amd64.s:1581\ngithub.com/tikv/client-go/v2/oracle/oracles.(*pdOracle).getTimestamp\n\t/go/pkg/mod/github.com/tikv/client-go/v2@v2.0.1/oracle/oracles/pd.go:148\ngithub.com/tikv/client-go/v2/oracle/oracles.(*pdOracle).updateTS.func1\n\t/go/pkg/mod/github.com/tikv/client-go/v2@v2.0.1/oracle/oracles/pd.go:234\nsync.(*Map).Range\n\t/usr/local/go/src/sync/map.go:346\ngithub.com/tikv/client-go/v2/oracle/oracles.(*pdOracle).updateTS\n\t/go/pkg/mod/github.com/tikv/client-go/v2@v2.0.1/oracle/oracles/pd.go:232\nruntime.goexit\n\t/usr/local/go/src/runtime/asm_amd64.s:1581"] [stack="github.com/tikv/client-go/v2/oracle/oracles.(*pdOracle).updateTS.func1\n\t/go/pkg/mod/github.com/tikv/client-go/v2@v2.0.1/oracle/oracles/pd.go:236\nsync.(*Map).Range\n\t/usr/local/go/src/sync/map.go:346\ngithub.com/tikv/client-go/v2/oracle/oracles.(*pdOracle).updateTS\n\t/go/pkg/mod/github.com/tikv/client-go/v2@v2.0.1/oracle/oracles/pd.go:232"]
[2022/08/30 11:00:32.246 +08:00] [ERROR] [client.go:528] ["[pd] tso request is canceled due to timeout"] [dc-location=global] [error="[PD:client:ErrClientGetTSOTimeout]get TSO timeout"] [stack="github.com/tikv/pd/client.(*client).watchTSDeadline.func1\n\t/go/pkg/mod/github.com/tikv/pd/client@v0.0.0-20220216070739-26c668271201/client.go:528"]
[2022/08/30 11:00:32.255 +08:00] [ERROR] [client.go:833] ["[pd] getTS error"] [dc-location=global] [stream-addr=https://xxxxxxxxxxxxx:12379] [error="[PD:client:ErrClientGetTSO]rpc error: code = Canceled desc = context canceled: rpc error: code = Canceled desc = context canceled"] [stack="github.com/tikv/pd/client.(*client).handleDispatcher\n\t/go/pkg/mod/github.com/tikv/pd/client@v0.0.0-20220216070739-26c668271201/client.go:833"]
{"level":"warn","ts":"2022-08-30T11:00:47.338+0800","logger":"etcd-client","caller":"v3@v3.5.2/retry_interceptor.go:62","msg":"retrying of unary invoker failed","target":"etcd-endpoints://0xc000818e00/xxxxxxxxxxxxx:12379","attempt":0,"error":"rpc error: code = DeadlineExceeded desc = context deadline exceeded"}
{"level":"warn","ts":"2022-08-30T11:02:21.317+0800","logger":"etcd-client","caller":"v3@v3.5.2/retry_interceptor.go:62","msg":"retrying of unary invoker failed","target":"etcd-endpoints://0xc000818e00/xxxxxxxxxxxxx:12379","attempt":0,"error":"rpc error: code = DeadlineExceeded desc = context deadline exceeded"}
{"level":"info","ts":"2022-08-30T11:02:21.320+0800","logger":"etcd-client","caller":"v3@v3.5.2/client.go:207","msg":"Auto sync endpoints failed.","error":"context deadline exceeded"}
[2022/08/30 11:02:21.319 +08:00] [ERROR] [kv.go:243] ["fail to load safepoint from pd"] [error="context deadline exceeded"] [errorVerbose="context deadline exceeded\ngithub.com/tikv/client-go/v2/tikv.(*EtcdSafePointKV).Get\n\t/go/pkg/mod/github.com/tikv/client-go/v2@v2.0.1/tikv/safepoint.go:148\ngithub.com/tikv/client-go/v2/tikv.loadSafePoint\n\t/go/pkg/mod/github.com/tikv/client-go/v2@v2.0.1/tikv/safepoint.go:183\ngithub.com/tikv/client-go/v2/tikv.(*KVStore).runSafePointChecker\n\t/go/pkg/mod/github.com/tikv/client-go/v2@v2.0.1/tikv/kv.go:236\nruntime.goexit\n\t/usr/local/go/src/runtime/asm_amd64.s:1581"] [stack="github.com/tikv/client-go/v2/tikv.(*KVStore).runSafePointChecker\n\t/go/pkg/mod/github.com/tikv/client-go/v2@v2.0.1/tikv/kv.go:243"]
[2022/08/30 11:01:29.114 +08:00] [ERROR] [client.go:528] ["[pd] tso request is canceled due to timeout"] [dc-location=global] [error="[PD:client:ErrClientGetTSOTimeout]get TSO timeout"] [stack="github.com/tikv/pd/client.(*client).watchTSDeadline.func1\n\t/go/pkg/mod/github.com/tikv/pd/client@v0.0.0-20220216070739-26c668271201/client.go:528"]
[2022/08/30 11:02:21.319 +08:00] [ERROR] [region_cache.go:1954] ["loadStore from PD failed"] [id=1] [error="rpc error: code = DeadlineExceeded desc = context deadline exceeded"] [errorVerbose="rpc error: code = DeadlineExceeded desc = context deadline exceeded\ngithub.com/tikv/pd/client.(*client).GetStore\n\t/go/pkg/mod/github.com/tikv/pd/client@v0.0.0-20220216070739-26c668271201/client.go:1524\ngithub.com/tikv/client-go/v2/util.InterceptedPDClient.GetStore\n\t/go/pkg/mod/github.com/tikv/client-go/v2@v2.0.1/util/pd_interceptor.go:132\ngithub.com/tikv/client-go/v2/internal/locate.(*Store).reResolve\n\t/go/pkg/mod/github.com/tikv/client-go/v2@v2.0.1/internal/locate/region_cache.go:1944\ngithub.com/tikv/client-go/v2/internal/locate.(*RegionCache).checkAndResolve\n\t/go/pkg/mod/github.com/tikv/client-go/v2@v2.0.1/internal/locate/region_cache.go:453\ngithub.com/tikv/client-go/v2/internal/locate.(*RegionCache).asyncCheckAndResolveLoop\n\t/go/pkg/mod/github.com/tikv/client-go/v2@v2.0.1/internal/locate/region_cache.go:422\nruntime.goexit\n\t/usr/local/go/src/runtime/asm_amd64.s:1581"] [stack="github.com/tikv/client-go/v2/internal/locate.(*Store).reResolve\n\t/go/pkg/mod/github.com/tikv/client-go/v2@v2.0.1/internal/locate/region_cache.go:1954\ngithub.com/tikv/client-go/v2/internal/locate.(*RegionCache).checkAndResolve\n\t/go/pkg/mod/github.com/tikv/client-go/v2@v2.0.1/internal/locate/region_cache.go:453\ngithub.com/tikv/client-go/v2/internal/locate.(*RegionCache).asyncCheckAndResolveLoop\n\t/go/pkg/mod/github.com/tikv/client-go/v2@v2.0.1/internal/locate/region_cache.go:422"]
[2022/08/30 11:02:21.321 +08:00] [ERROR] [client.go:833] ["[pd] getTS error"] [dc-location=global] [stream-addr=https://xxxxxxxxxxxxx:12379] [error="[PD:client:ErrClientGetTSO]rpc error: code = Canceled desc = context canceled: rpc error: code = Canceled desc = context canceled"] [stack="github.com/tikv/pd/client.(*client).handleDispatcher\n\t/go/pkg/mod/github.com/tikv/pd/client@v0.0.0-20220216070739-26c668271201/client.go:833"]
[2022/08/30 11:02:21.325 +08:00] [ERROR] [error.go:289] ["encountered error"] [error="rpc error: code = DeadlineExceeded desc = context deadline exceeded"] [errorVerbose="rpc error: code = DeadlineExceeded desc = context deadline exceeded\ngithub.com/tikv/pd/client.(*client).GetStore\n\t/go/pkg/mod/github.com/tikv/pd/client@v0.0.0-20220216070739-26c668271201/client.go:1524\ngithub.com/tikv/client-go/v2/util.InterceptedPDClient.GetStore\n\t/go/pkg/mod/github.com/tikv/client-go/v2@v2.0.1/util/pd_interceptor.go:132\ngithub.com/tikv/client-go/v2/internal/locate.(*Store).reResolve\n\t/go/pkg/mod/github.com/tikv/client-go/v2@v2.0.1/internal/locate/region_cache.go:1944\ngithub.com/tikv/client-go/v2/internal/locate.(*RegionCache).checkAndResolve\n\t/go/pkg/mod/github.com/tikv/client-go/v2@v2.0.1/internal/locate/region_cache.go:453\ngithub.com/tikv/client-go/v2/internal/locate.(*RegionCache).asyncCheckAndResolveLoop\n\t/go/pkg/mod/github.com/tikv/client-go/v2@v2.0.1/internal/locate/region_cache.go:422\nruntime.goexit\n\t/usr/local/go/src/runtime/asm_amd64.s:1581"] [stack="github.com/tikv/client-go/v2/error.Log\n\t/go/pkg/mod/github.com/tikv/client-go/v2@v2.0.1/error/error.go:289\ngithub.com/tikv/client-go/v2/internal/locate.(*RegionCache).checkAndResolve\n\t/go/pkg/mod/github.com/tikv/client-go/v2@v2.0.1/internal/locate/region_cache.go:454\ngithub.com/tikv/client-go/v2/internal/locate.(*RegionCache).asyncCheckAndResolveLoop\n\t/go/pkg/mod/github.com/tikv/client-go/v2@v2.0.1/internal/locate/region_cache.go:422"] [stack="github.com/tikv/client-go/v2/error.Log\n\t/go/pkg/mod/github.com/tikv/client-go/v2@v2.0.1/error/error.go:289\ngithub.com/tikv/client-go/v2/internal/locate.(*RegionCache).checkAndResolve\n\t/go/pkg/mod/github.com/tikv/client-go/v2@v2.0.1/internal/locate/region_cache.go:454\ngithub.com/tikv/client-go/v2/internal/locate.(*RegionCache).asyncCheckAndResolveLoop\n\t/go/pkg/mod/github.com/tikv/client-go/v2@v2.0.1/internal/locate/region_cache.go:422"]
[2022/08/30 11:02:21.321 +08:00] [ERROR] [pd.go:236] ["updateTS error"] [txnScope=global] [error="rpc error: code = Canceled desc = context canceled"] [errorVerbose="rpc error: code = Canceled desc = context canceled\ngithub.com/tikv/pd/client.(*client).processTSORequests\n\t/go/pkg/mod/github.com/tikv/pd/client@v0.0.0-20220216070739-26c668271201/client.go:1067\ngithub.com/tikv/pd/client.(*client).handleDispatcher\n\t/go/pkg/mod/github.com/tikv/pd/client@v0.0.0-20220216070739-26c668271201/client.go:823\nruntime.goexit\n\t/usr/local/go/src/runtime/asm_amd64.s:1581\ngithub.com/tikv/pd/client.(*tsoRequest).Wait\n\t/go/pkg/mod/github.com/tikv/pd/client@v0.0.0-20220216070739-26c668271201/client.go:1283\ngithub.com/tikv/pd/client.(*client).GetTS\n\t/go/pkg/mod/github.com/tikv/pd/client@v0.0.0-20220216070739-26c668271201/client.go:1303\ngithub.com/tikv/client-go/v2/util.InterceptedPDClient.GetTS\n\t/go/pkg/mod/github.com/tikv/client-go/v2@v2.0.1/util/pd_interceptor.go:81\ngithub.com/tikv/client-go/v2/oracle/oracles.(*pdOracle).getTimestamp\n\t/go/pkg/mod/github.com/tikv/client-go/v2@v2.0.1/oracle/oracles/pd.go:143\ngithub.com/tikv/client-go/v2/oracle/oracles.(*pdOracle).updateTS.func1\n\t/go/pkg/mod/github.com/tikv/client-go/v2@v2.0.1/oracle/oracles/pd.go:234\nsync.(*Map).Range\n\t/usr/local/go/src/sync/map.go:346\ngithub.com/tikv/client-go/v2/oracle/oracles.(*pdOracle).updateTS\n\t/go/pkg/mod/github.com/tikv/client-go/v2@v2.0.1/oracle/oracles/pd.go:232\nruntime.goexit\n\t/usr/local/go/src/runtime/asm_amd64.s:1581\ngithub.com/tikv/client-go/v2/oracle/oracles.(*pdOracle).getTimestamp\n\t/go/pkg/mod/github.com/tikv/client-go/v2@v2.0.1/oracle/oracles/pd.go:148\ngithub.com/tikv/client-go/v2/oracle/oracles.(*pdOracle).updateTS.func1\n\t/go/pkg/mod/github.com/tikv/client-go/v2@v2.0.1/oracle/oracles/pd.go:234\nsync.(*Map).Range\n\t/usr/local/go/src/sync/map.go:346\ngithub.com/tikv/client-go/v2/oracle/oracles.(*pdOracle).updateTS\n\t/go/pkg/mod/github.com/tikv/client-go/v2@v2.0.1/oracle/oracles/pd.go:232\nruntime.goexit\n\t/usr/local/go/src/runtime/asm_amd64.s:1581"] [stack="github.com/tikv/client-go/v2/oracle/oracles.(*pdOracle).updateTS.func1\n\t/go/pkg/mod/github.com/tikv/client-go/v2@v2.0.1/oracle/oracles/pd.go:236\nsync.(*Map).Range\n\t/usr/local/go/src/sync/map.go:346\ngithub.com/tikv/client-go/v2/oracle/oracles.(*pdOracle).updateTS\n\t/go/pkg/mod/github.com/tikv/client-go/v2@v2.0.1/oracle/oracles/pd.go:232"]
[2022/08/30 11:02:22.327 +08:00] [WARN] [pd.go:152] ["get timestamp too slow"] ["cost time"=1.007131406s]
[2022/08/30 11:02:22.327 +08:00] [WARN] [pd.go:152] ["get timestamp too slow"] ["cost time"=1.0019698s]
[2022/08/30 11:02:22.327 +08:00] [WARN] [pd.go:152] ["get timestamp too slow"] ["cost time"=644.942453ms]
[2022/08/30 11:02:22.327 +08:00] [WARN] [pd.go:152] ["get timestamp too slow"] ["cost time"=670.135406ms]
[2022/08/30 11:02:22.327 +08:00] [WARN] [pd.go:152] ["get timestamp too slow"] ["cost time"=560.419974ms]
[2022/08/30 11:02:22.327 +08:00] [WARN] [pd.go:152] ["get timestamp too slow"] ["cost time"=264.357153ms]
[2022/08/30 11:02:22.327 +08:00] [WARN] [pd.go:152] ["get timestamp too slow"] ["cost time"=1m32.295050612s]
[2022/08/30 11:02:22.327 +08:00] [WARN] [pd.go:152] ["get timestamp too slow"] ["cost time"=1.008201277s]
[2022/08/30 11:02:22.327 +08:00] [WARN] [pd.go:152] ["get timestamp too slow"] ["cost time"=1.007816809s]
{"level":"warn","ts":"2022-08-30T11:03:11.842+0800","logger":"etcd-client","caller":"v3@v3.5.2/retry_interceptor.go:62","msg":"retrying of unary invoker failed","target":"etcd-endpoints://0xc000818e00/xxxxxxxxxxxxx:12379","attempt":0,"error":"rpc error: code = DeadlineExceeded desc = context deadline exceeded"}
[2022/08/30 11:03:12.592 +08:00] [ERROR] [client.go:528] ["[pd] tso request is canceled due to timeout"] [dc-location=global] [error="[PD:client:ErrClientGetTSOTimeout]get TSO timeout"] [stack="github.com/tikv/pd/client.(*client).watchTSDeadline.func1\n\t/go/pkg/mod/github.com/tikv/pd/client@v0.0.0-20220216070739-26c668271201/client.go:528"]
[2022/08/30 11:03:17.163 +08:00] [ERROR] [kv.go:243] ["fail to load safepoint from pd"] [error="context deadline exceeded"] [errorVerbose="context deadline exceeded\ngithub.com/tikv/client-go/v2/tikv.(*EtcdSafePointKV).Get\n\t/go/pkg/mod/github.com/tikv/client-go/v2@v2.0.1/tikv/safepoint.go:148\ngithub.com/tikv/client-go/v2/tikv.loadSafePoint\n\t/go/pkg/mod/github.com/tikv/client-go/v2@v2.0.1/tikv/safepoint.go:183\ngithub.com/tikv/client-go/v2/tikv.(*KVStore).runSafePointChecker\n\t/go/pkg/mod/github.com/tikv/client-go/v2@v2.0.1/tikv/kv.go:236\nruntime.goexit\n\t/usr/local/go/src/runtime/asm_amd64.s:1581"] [stack="github.com/tikv/client-go/v2/tikv.(*KVStore).runSafePointChecker\n\t/go/pkg/mod/github.com/tikv/client-go/v2@v2.0.1/tikv/kv.go:243"]
{"level":"warn","ts":"2022-08-30T11:03:10.451+0800","logger":"etcd-client","caller":"v3@v3.5.2/retry_interceptor.go:62","msg":"retrying of unary invoker failed","target":"etcd-endpoints://0xc000818e00/xxxxxxxxxxxxx:12379","attempt":0,"error":"rpc error: code = DeadlineExceeded desc = context deadline exceeded"}
[2022/08/30 11:03:19.452 +08:00] [ERROR] [client.go:833] ["[pd] getTS error"] [dc-location=global] [stream-addr=https://xxxxxxxxxxxxx:12379] [error="[PD:client:ErrClientGetTSO]EOF: EOF"] [stack="github.com/tikv/pd/client.(*client).handleDispatcher\n\t/go/pkg/mod/github.com/tikv/pd/client@v0.0.0-20220216070739-26c668271201/client.go:833"]
[2022/08/30 11:03:19.455 +08:00] [ERROR] [pd.go:236] ["updateTS error"] [txnScope=global] [error=EOF] [errorVerbose="EOF\ngithub.com/tikv/pd/client.(*client).processTSORequests\n\t/go/pkg/mod/github.com/tikv/pd/client@v0.0.0-20220216070739-26c668271201/client.go:1060\ngithub.com/tikv/pd/client.(*client).handleDispatcher\n\t/go/pkg/mod/github.com/tikv/pd/client@v0.0.0-20220216070739-26c668271201/client.go:823\nruntime.goexit\n\t/usr/local/go/src/runtime/asm_amd64.s:1581\ngithub.com/tikv/pd/client.(*tsoRequest).Wait\n\t/go/pkg/mod/github.com/tikv/pd/client@v0.0.0-20220216070739-26c668271201/client.go:1283\ngithub.com/tikv/pd/client.(*client).GetTS\n\t/go/pkg/mod/github.com/tikv/pd/client@v0.0.0-20220216070739-26c668271201/client.go:1303\ngithub.com/tikv/client-go/v2/util.InterceptedPDClient.GetTS\n\t/go/pkg/mod/github.com/tikv/client-go/v2@v2.0.1/util/pd_interceptor.go:81\ngithub.com/tikv/client-go/v2/oracle/oracles.(*pdOracle).getTimestamp\n\t/go/pkg/mod/github.com/tikv/client-go/v2@v2.0.1/oracle/oracles/pd.go:143\ngithub.com/tikv/client-go/v2/oracle/oracles.(*pdOracle).updateTS.func1\n\t/go/pkg/mod/github.com/tikv/client-go/v2@v2.0.1/oracle/oracles/pd.go:234\nsync.(*Map).Range\n\t/usr/local/go/src/sync/map.go:346\ngithub.com/tikv/client-go/v2/oracle/oracles.(*pdOracle).updateTS\n\t/go/pkg/mod/github.com/tikv/client-go/v2@v2.0.1/oracle/oracles/pd.go:232\nruntime.goexit\n\t/usr/local/go/src/runtime/asm_amd64.s:1581\ngithub.com/tikv/client-go/v2/oracle/oracles.(*pdOracle).getTimestamp\n\t/go/pkg/mod/github.com/tikv/client-go/v2@v2.0.1/oracle/oracles/pd.go:148\ngithub.com/tikv/client-go/v2/oracle/oracles.(*pdOracle).updateTS.func1\n\t/go/pkg/mod/github.com/tikv/client-go/v2@v2.0.1/oracle/oracles/pd.go:234\nsync.(*Map).Range\n\t/usr/local/go/src/sync/map.go:346\ngithub.com/tikv/client-go/v2/oracle/oracles.(*pdOracle).updateTS\n\t/go/pkg/mod/github.com/tikv/client-go/v2@v2.0.1/oracle/oracles/pd.go:232\nruntime.goexit\n\t/usr/local/go/src/runtime/asm_amd64.s:1581"] [stack="github.com/tikv/client-go/v2/oracle/oracles.(*pdOracle).updateTS.func1\n\t/go/pkg/mod/github.com/tikv/client-go/v2@v2.0.1/oracle/oracles/pd.go:236\nsync.(*Map).Range\n\t/usr/local/go/src/sync/map.go:346\ngithub.com/tikv/client-go/v2/oracle/oracles.(*pdOracle).updateTS\n\t/go/pkg/mod/github.com/tikv/client-go/v2@v2.0.1/oracle/oracles/pd.go:232"]
{"level":"info","ts":"2022-08-30T11:03:19.767+0800","logger":"etcd-client","caller":"v3@v3.5.2/client.go:207","msg":"Auto sync endpoints failed.","error":"context deadline exceeded"}
[2022/08/30 11:03:23.460 +08:00] [ERROR] [client.go:528] ["[pd] tso request is canceled due to timeout"] [dc-location=global] [error="[PD:client:ErrClientGetTSOTimeout]get TSO timeout"] [stack="github.com/tikv/pd/client.(*client).watchTSDeadline.func1\n\t/go/pkg/mod/github.com/tikv/pd/client@v0.0.0-20220216070739-26c668271201/client.go:528"]
[2022/08/30 11:03:23.467 +08:00] [ERROR] [client.go:833] ["[pd] getTS error"] [dc-location=global] [stream-addr=https://xxxxxxxxxxxxx:12379] [error="[PD:client:ErrClientGetTSO]rpc error: code = Canceled desc = context canceled: rpc error: code = Canceled desc = context canceled"] [stack="github.com/tikv/pd/client.(*client).handleDispatcher\n\t/go/pkg/mod/github.com/tikv/pd/client@v0.0.0-20220216070739-26c668271201/client.go:833"]
[2022/08/30 11:03:30.144 +08:00] [ERROR] [client.go:528] ["[pd] tso request is canceled due to timeout"] [dc-location=global] [error="[PD:client:ErrClientGetTSOTimeout]get TSO timeout"] [stack="github.com/tikv/pd/client.(*client).watchTSDeadline.func1\n\t/go/pkg/mod/github.com/tikv/pd/client@v0.0.0-20220216070739-26c668271201/client.go:528"]
[2022/08/30 11:03:30.156 +08:00] [ERROR] [client.go:833] ["[pd] getTS error"] [dc-location=global] [stream-addr=https://xxxxxxxxxxxxx:12379] [error="[PD:client:ErrClientGetTSO]rpc error: code = Canceled desc = context canceled: rpc error: code = Canceled desc = context canceled"] [stack="github.com/tikv/pd/client.(*client).handleDispatcher\n\t/go/pkg/mod/github.com/tikv/pd/client@v0.0.0-20220216070739-26c668271201/client.go:833"]
[2022/08/30 11:03:30.158 +08:00] [ERROR] [pd.go:236] ["updateTS error"] [txnScope=global] [error="rpc error: code = Canceled desc = context canceled"] [errorVerbose="rpc error: code = Canceled desc = context canceled\ngithub.com/tikv/pd/client.(*client).processTSORequests\n\t/go/pkg/mod/github.com/tikv/pd/client@v0.0.0-20220216070739-26c668271201/client.go:1067\ngithub.com/tikv/pd/client.(*client).handleDispatcher\n\t/go/pkg/mod/github.com/tikv/pd/client@v0.0.0-20220216070739-26c668271201/client.go:823\nruntime.goexit\n\t/usr/local/go/src/runtime/asm_amd64.s:1581\ngithub.com/tikv/pd/client.(*tsoRequest).Wait\n\t/go/pkg/mod/github.com/tikv/pd/client@v0.0.0-20220216070739-26c668271201/client.go:1283\ngithub.com/tikv/pd/client.(*client).GetTS\n\t/go/pkg/mod/github.com/tikv/pd/client@v0.0.0-20220216070739-26c668271201/client.go:1303\ngithub.com/tikv/client-go/v2/util.InterceptedPDClient.GetTS\n\t/go/pkg/mod/github.com/tikv/client-go/v2@v2.0.1/util/pd_interceptor.go:81\ngithub.com/tikv/client-go/v2/oracle/oracles.(*pdOracle).getTimestamp\n\t/go/pkg/mod/github.com/tikv/client-go/v2@v2.0.1/oracle/oracles/pd.go:143\ngithub.com/tikv/client-go/v2/oracle/oracles.(*pdOracle).updateTS.func1\n\t/go/pkg/mod/github.com/tikv/client-go/v2@v2.0.1/oracle/oracles/pd.go:234\nsync.(*Map).Range\n\t/usr/local/go/src/sync/map.go:346\ngithub.com/tikv/client-go/v2/oracle/oracles.(*pdOracle).updateTS\n\t/go/pkg/mod/github.com/tikv/client-go/v2@v2.0.1/oracle/oracles/pd.go:232\nruntime.goexit\n\t/usr/local/go/src/runtime/asm_amd64.s:1581\ngithub.com/tikv/client-go/v2/oracle/oracles.(*pdOracle).getTimestamp\n\t/go/pkg/mod/github.com/tikv/client-go/v2@v2.0.1/oracle/oracles/pd.go:148\ngithub.com/tikv/client-go/v2/oracle/oracles.(*pdOracle).updateTS.func1\n\t/go/pkg/mod/github.com/tikv/client-go/v2@v2.0.1/oracle/oracles/pd.go:234\nsync.(*Map).Range\n\t/usr/local/go/src/sync/map.go:346\ngithub.com/tikv/client-go/v2/oracle/oracles.(*pdOracle).updateTS\n\t/go/pkg/mod/github.com/tikv/client-go/v2@v2.0.1/oracle/oracles/pd.go:232\nruntime.goexit\n\t/usr/local/go/src/runtime/asm_amd64.s:1581"] [stack="github.com/tikv/client-go/v2/oracle/oracles.(*pdOracle).updateTS.func1\n\t/go/pkg/mod/github.com/tikv/client-go/v2@v2.0.1/oracle/oracles/pd.go:236\nsync.(*Map).Range\n\t/usr/local/go/src/sync/map.go:346\ngithub.com/tikv/client-go/v2/oracle/oracles.(*pdOracle).updateTS\n\t/go/pkg/mod/github.com/tikv/client-go/v2@v2.0.1/oracle/oracles/pd.go:232"]
[2022/08/30 11:03:34.037 +08:00] [WARN] [pd.go:152] ["get timestamp too slow"] ["cost time"=10.300621999s]
[2022/08/30 11:03:34.045 +08:00] [WARN] [pd.go:152] ["get timestamp too slow"] ["cost time"=10.02964886s]
[2022/08/30 11:03:34.046 +08:00] [WARN] [pd.go:152] ["get timestamp too slow"] ["cost time"=8.749069151s]
[2022/08/30 11:03:34.046 +08:00] [WARN] [pd.go:152] ["get timestamp too slow"] ["cost time"=7.231212138s]
[2022/08/30 11:03:34.046 +08:00] [WARN] [pd.go:152] ["get timestamp too slow"] ["cost time"=7.231496279s]
[2022/08/30 11:03:34.047 +08:00] [WARN] [pd.go:152] ["get timestamp too slow"] ["cost time"=4.672809581s]
[2022/08/30 11:03:34.047 +08:00] [WARN] [pd.go:152] ["get timestamp too slow"] ["cost time"=3.887317712s]
[2022/08/30 11:04:10.091 +08:00] [WARN] [pd.go:152] ["get timestamp too slow"] ["cost time"=8.069105069s]
[2022/08/30 11:04:11.012 +08:00] [WARN] [pd.go:152] ["get timestamp too slow"] ["cost time"=30.982757013s]
[2022/08/30 11:04:11.012 +08:00] [WARN] [pd.go:152] ["get timestamp too slow"] ["cost time"=30.9787157s]
[2022/08/30 11:04:00.785 +08:00] [ERROR] [client.go:528] ["[pd] tso request is canceled due to timeout"] [dc-location=global] [error="[PD:client:ErrClientGetTSOTimeout]get TSO timeout"] [stack="github.com/tikv/pd/client.(*client).watchTSDeadline.func1\n\t/go/pkg/mod/github.com/tikv/pd/client@v0.0.0-20220216070739-26c668271201/client.go:528"]
[2022/08/30 11:04:14.023 +08:00] [ERROR] [client.go:833] ["[pd] getTS error"] [dc-location=global] [stream-addr=https://xxxxxxxxxxxxx:12379] [error="[PD:client:ErrClientGetTSO]rpc error: code = Canceled desc = context canceled: rpc error: code = Canceled desc = context canceled"] [stack="github.com/tikv/pd/client.(*client).handleDispatcher\n\t/go/pkg/mod/github.com/tikv/pd/client@v0.0.0-20220216070739-26c668271201/client.go:833"]
[2022/08/30 11:04:15.963 +08:00] [WARN] [pd.go:152] ["get timestamp too slow"] ["cost time"=17.543620032s]
{"level":"warn","ts":"2022-08-30T11:04:17.174+0800","logger":"etcd-client","caller":"v3@v3.5.2/retry_interceptor.go:62","msg":"retrying of unary invoker failed","target":"etcd-endpoints://0xc000818e00/xxxxxxxxxxxxx:12379","attempt":0,"error":"rpc error: code = DeadlineExceeded desc = context deadline exceeded"}
[2022/08/30 11:04:08.997 +08:00] [WARN] [pd.go:152] ["get timestamp too slow"] ["cost time"=31.085503213s]
[2022/08/30 11:04:18.393 +08:00] [WARN] [client_batch.go:365] ["no available connections"] [target=xxxxxxxxxxxxx:20160]
[2022/08/30 11:04:19.984 +08:00] [ERROR] [pd.go:236] ["updateTS error"] [txnScope=global] [error="rpc error: code = Canceled desc = context canceled"] [errorVerbose="rpc error: code = Canceled desc = context canceled\ngithub.com/tikv/pd/client.(*client).processTSORequests\n\t/go/pkg/mod/github.com/tikv/pd/client@v0.0.0-20220216070739-26c668271201/client.go:1067\ngithub.com/tikv/pd/client.(*client).handleDispatcher\n\t/go/pkg/mod/github.com/tikv/pd/client@v0.0.0-20220216070739-26c668271201/client.go:823\nruntime.goexit\n\t/usr/local/go/src/runtime/asm_amd64.s:1581\ngithub.com/tikv/pd/client.(*tsoRequest).Wait\n\t/go/pkg/mod/github.com/tikv/pd/client@v0.0.0-20220216070739-26c668271201/client.go:1283\ngithub.com/tikv/pd/client.(*client).GetTS\n\t/go/pkg/mod/github.com/tikv/pd/client@v0.0.0-20220216070739-26c668271201/client.go:1303\ngithub.com/tikv/client-go/v2/util.InterceptedPDClient.GetTS\n\t/go/pkg/mod/github.com/tikv/client-go/v2@v2.0.1/util/pd_interceptor.go:81\ngithub.com/tikv/client-go/v2/oracle/oracles.(*pdOracle).getTimestamp\n\t/go/pkg/mod/github.com/tikv/client-go/v2@v2.0.1/oracle/oracles/pd.go:143\ngithub.com/tikv/client-go/v2/oracle/oracles.(*pdOracle).updateTS.func1\n\t/go/pkg/mod/github.com/tikv/client-go/v2@v2.0.1/oracle/oracles/pd.go:234\nsync.(*Map).Range\n\t/usr/local/go/src/sync/map.go:346\ngithub.com/tikv/client-go/v2/oracle/oracles.(*pdOracle).updateTS\n\t/go/pkg/mod/github.com/tikv/client-go/v2@v2.0.1/oracle/oracles/pd.go:232\nruntime.goexit\n\t/usr/local/go/src/runtime/asm_amd64.s:1581\ngithub.com/tikv/client-go/v2/oracle/oracles.(*pdOracle).getTimestamp\n\t/go/pkg/mod/github.com/tikv/client-go/v2@v2.0.1/oracle/oracles/pd.go:148\ngithub.com/tikv/client-go/v2/oracle/oracles.(*pdOracle).updateTS.func1\n\t/go/pkg/mod/github.com/tikv/client-go/v2@v2.0.1/oracle/oracles/pd.go:234\nsync.(*Map).Range\n\t/usr/local/go/src/sync/map.go:346\ngithub.com/tikv/client-go/v2/oracle/oracles.(*pdOracle).updateTS\n\t/go/pkg/mod/github.com/tikv/client-go/v2@v2.0.1/oracle/oracles/pd.go:232\nruntime.goexit\n\t/usr/local/go/src/runtime/asm_amd64.s:1581"] [stack="github.com/tikv/client-go/v2/oracle/oracles.(*pdOracle).updateTS.func1\n\t/go/pkg/mod/github.com/tikv/client-go/v2@v2.0.1/oracle/oracles/pd.go:236\nsync.(*Map).Range\n\t/usr/local/go/src/sync/map.go:346\ngithub.com/tikv/client-go/v2/oracle/oracles.(*pdOracle).updateTS\n\t/go/pkg/mod/github.com/tikv/client-go/v2@v2.0.1/oracle/oracles/pd.go:232"]
{"level":"info","ts":"2022-08-30T11:05:29.042+0800","logger":"etcd-client","caller":"v3@v3.5.2/client.go:207","msg":"Auto sync endpoints failed.","error":"context deadline exceeded"}
[2022/08/30 11:05:24.235 +08:00] [WARN] [client_batch.go:365] ["no available connections"] [target=xxxxxxxxxxxxx:20160]
[2022/08/30 11:04:21.419 +08:00] [ERROR] [region_cache.go:1954] ["loadStore from PD failed"] [id=2] [error="rpc error: code = DeadlineExceeded desc = context deadline exceeded"] [errorVerbose="rpc error: code = DeadlineExceeded desc = context deadline exceeded\ngithub.com/tikv/pd/client.(*client).GetStore\n\t/go/pkg/mod/github.com/tikv/pd/client@v0.0.0-20220216070739-26c668271201/client.go:1524\ngithub.com/tikv/client-go/v2/util.InterceptedPDClient.GetStore\n\t/go/pkg/mod/github.com/tikv/client-go/v2@v2.0.1/util/pd_interceptor.go:132\ngithub.com/tikv/client-go/v2/internal/locate.(*Store).reResolve\n\t/go/pkg/mod/github.com/tikv/client-go/v2@v2.0.1/internal/locate/region_cache.go:1944\ngithub.com/tikv/client-go/v2/internal/locate.(*RegionCache).checkAndResolve\n\t/go/pkg/mod/github.com/tikv/client-go/v2@v2.0.1/internal/locate/region_cache.go:453\ngithub.com/tikv/client-go/v2/internal/locate.(*RegionCache).asyncCheckAndResolveLoop\n\t/go/pkg/mod/github.com/tikv/client-go/v2@v2.0.1/internal/locate/region_cache.go:417\nruntime.goexit\n\t/usr/local/go/src/runtime/asm_amd64.s:1581"] [stack="github.com/tikv/client-go/v2/internal/locate.(*Store).reResolve\n\t/go/pkg/mod/github.com/tikv/client-go/v2@v2.0.1/internal/locate/region_cache.go:1954\ngithub.com/tikv/client-go/v2/internal/locate.(*RegionCache).checkAndResolve\n\t/go/pkg/mod/github.com/tikv/client-go/v2@v2.0.1/internal/locate/region_cache.go:453\ngithub.com/tikv/client-go/v2/internal/locate.(*RegionCache).asyncCheckAndResolveLoop\n\t/go/pkg/mod/github.com/tikv/client-go/v2@v2.0.1/internal/locate/region_cache.go:417"]
[2022/08/30 11:05:44.927 +08:00] [ERROR] [error.go:289] ["encountered error"] [error="rpc error: code = DeadlineExceeded desc = context deadline exceeded"] [errorVerbose="rpc error: code = DeadlineExceeded desc = context deadline exceeded\ngithub.com/tikv/pd/client.(*client).GetStore\n\t/go/pkg/mod/github.com/tikv/pd/client@v0.0.0-20220216070739-26c668271201/client.go:1524\ngithub.com/tikv/client-go/v2/util.InterceptedPDClient.GetStore\n\t/go/pkg/mod/github.com/tikv/client-go/v2@v2.0.1/util/pd_interceptor.go:132\ngithub.com/tikv/client-go/v2/internal/locate.(*Store).reResolve\n\t/go/pkg/mod/github.com/tikv/client-go/v2@v2.0.1/internal/locate/region_cache.go:1944\ngithub.com/tikv/client-go/v2/internal/locate.(*RegionCache).checkAndResolve\n\t/go/pkg/mod/github.com/tikv/client-go/v2@v2.0.1/internal/locate/region_cache.go:453\ngithub.com/tikv/client-go/v2/internal/locate.(*RegionCache).asyncCheckAndResolveLoop\n\t/go/pkg/mod/github.com/tikv/client-go/v2@v2.0.1/internal/locate/region_cache.go:417\nruntime.goexit\n\t/usr/local/go/src/runtime/asm_amd64.s:1581"] [stack="github.com/tikv/client-go/v2/error.Log\n\t/go/pkg/mod/github.com/tikv/client-go/v2@v2.0.1/error/error.go:289\ngithub.com/tikv/client-go/v2/internal/locate.(*RegionCache).checkAndResolve\n\t/go/pkg/mod/github.com/tikv/client-go/v2@v2.0.1/internal/locate/region_cache.go:454\ngithub.com/tikv/client-go/v2/internal/locate.(*RegionCache).asyncCheckAndResolveLoop\n\t/go/pkg/mod/github.com/tikv/client-go/v2@v2.0.1/internal/locate/region_cache.go:417"] [stack="github.com/tikv/client-go/v2/error.Log\n\t/go/pkg/mod/github.com/tikv/client-go/v2@v2.0.1/error/error.go:289\ngithub.com/tikv/client-go/v2/internal/locate.(*RegionCache).checkAndResolve\n\t/go/pkg/mod/github.com/tikv/client-go/v2@v2.0.1/internal/locate/region_cache.go:454\ngithub.com/tikv/client-go/v2/internal/locate.(*RegionCache).asyncCheckAndResolveLoop\n\t/go/pkg/mod/github.com/tikv/client-go/v2@v2.0.1/internal/locate/region_cache.go:417"]
[2022/08/30 11:05:47.959 +08:00] [ERROR] [client.go:833] ["[pd] getTS error"] [dc-location=global] [stream-addr=https://xxxxxxxxxxxxx:12379] [error="[PD:client:ErrClientGetTSO]rpc error: code = Unavailable desc = keepalive ping failed to receive ACK within timeout: rpc error: code = Unavailable desc = keepalive ping failed to receive ACK within timeout"] [stack="github.com/tikv/pd/client.(*client).handleDispatcher\n\t/go/pkg/mod/github.com/tikv/pd/client@v0.0.0-20220216070739-26c668271201/client.go:833"]
[2022/08/30 11:04:23.309 +08:00] [ERROR] [client.go:528] ["[pd] tso request is canceled due to timeout"] [dc-location=global] [error="[PD:client:ErrClientGetTSOTimeout]get TSO timeout"] [stack="github.com/tikv/pd/client.(*client).watchTSDeadline.func1\n\t/go/pkg/mod/github.com/tikv/pd/client@v0.0.0-20220216070739-26c668271201/client.go:528"]
[2022/08/30 11:05:50.957 +08:00] [WARN] [client_batch.go:365] ["no available connections"] [target=xxxxxxxxxxxxx:20160]
[2022/08/30 11:05:51.736 +08:00] [WARN] [pd.go:152] ["get timestamp too slow"] ["cost time"=1m31.750114113s]
[2022/08/30 11:05:51.737 +08:00] [WARN] [pd.go:152] ["get timestamp too slow"] ["cost time"=1m29.790393518s]
[2022/08/30 11:05:51.741 +08:00] [WARN] [pd.go:152] ["get timestamp too slow"] ["cost time"=42.09825719s]
[2022/08/30 11:05:51.742 +08:00] [WARN] [pd.go:152] ["get timestamp too slow"] ["cost time"=26.738355132s]
[2022/08/30 11:05:51.742 +08:00] [WARN] [pd.go:152] ["get timestamp too slow"] ["cost time"=26.739147743s]
[2022/08/30 11:05:51.743 +08:00] [WARN] [pd.go:152] ["get timestamp too slow"] ["cost time"=26.233897233s]
[2022/08/30 11:05:51.743 +08:00] [WARN] [pd.go:152] ["get timestamp too slow"] ["cost time"=4.596655289s]
[2022/08/30 11:05:51.743 +08:00] [WARN] [pd.go:152] ["get timestamp too slow"] ["cost time"=1.812501964s]
[2022/08/30 11:05:51.743 +08:00] [WARN] [pd.go:152] ["get timestamp too slow"] ["cost time"=1.81204165s]
[2022/08/30 11:05:51.745 +08:00] [WARN] [client_batch.go:365] ["no available connections"] [target=xxxxxxxxxxxxx:20160]
[2022/08/30 11:05:51.745 +08:00] [WARN] [client_batch.go:365] ["no available connections"] [target=xxxxxxxxxxxxx:20160]
[2022/08/30 11:05:51.745 +08:00] [WARN] [client_batch.go:365] ["no available connections"] [target=xxxxxxxxxxxxx:20160]
[2022/08/30 11:05:51.746 +08:00] [WARN] [client_batch.go:365] ["no available connections"] [target=xxxxxxxxxxxxx:20160]
[2022/08/30 11:05:51.805 +08:00] [WARN] [client_batch.go:365] ["no available connections"] [target=xxxxxxxxxxxxx:20160]
[2022/08/30 11:05:47.932 +08:00] [ERROR] [region_cache.go:1954] ["loadStore from PD failed"] [id=1] [error="rpc error: code = DeadlineExceeded desc = context deadline exceeded"] [errorVerbose="rpc error: code = DeadlineExceeded desc = context deadline exceeded\ngithub.com/tikv/pd/client.(*client).GetStore\n\t/go/pkg/mod/github.com/tikv/pd/client@v0.0.0-20220216070739-26c668271201/client.go:1524\ngithub.com/tikv/client-go/v2/util.InterceptedPDClient.GetStore\n\t/go/pkg/mod/github.com/tikv/client-go/v2@v2.0.1/util/pd_interceptor.go:132\ngithub.com/tikv/client-go/v2/internal/locate.(*Store).reResolve\n\t/go/pkg/mod/github.com/tikv/client-go/v2@v2.0.1/internal/locate/region_cache.go:1944\ngithub.com/tikv/client-go/v2/internal/locate.(*RegionCache).checkAndResolve\n\t/go/pkg/mod/github.com/tikv/client-go/v2@v2.0.1/internal/locate/region_cache.go:453\ngithub.com/tikv/client-go/v2/internal/locate.(*RegionCache).asyncCheckAndResolveLoop\n\t/go/pkg/mod/github.com/tikv/client-go/v2@v2.0.1/internal/locate/region_cache.go:422\nruntime.goexit\n\t/usr/local/go/src/runtime/asm_amd64.s:1581"] [stack="github.com/tikv/client-go/v2/internal/locate.(*Store).reResolve\n\t/go/pkg/mod/github.com/tikv/client-go/v2@v2.0.1/internal/locate/region_cache.go:1954\ngithub.com/tikv/client-go/v2/internal/locate.(*RegionCache).checkAndResolve\n\t/go/pkg/mod/github.com/tikv/client-go/v2@v2.0.1/internal/locate/region_cache.go:453\ngithub.com/tikv/client-go/v2/internal/locate.(*RegionCache).asyncCheckAndResolveLoop\n\t/go/pkg/mod/github.com/tikv/client-go/v2@v2.0.1/internal/locate/region_cache.go:422"]
[2022/08/30 11:05:51.831 +08:00] [ERROR] [error.go:289] ["encountered error"] [error="rpc error: code = DeadlineExceeded desc = context deadline exceeded"] [errorVerbose="rpc error: code = DeadlineExceeded desc = context deadline exceeded\ngithub.com/tikv/pd/client.(*client).GetStore\n\t/go/pkg/mod/github.com/tikv/pd/client@v0.0.0-20220216070739-26c668271201/client.go:1524\ngithub.com/tikv/client-go/v2/util.InterceptedPDClient.GetStore\n\t/go/pkg/mod/github.com/tikv/client-go/v2@v2.0.1/util/pd_interceptor.go:132\ngithub.com/tikv/client-go/v2/internal/locate.(*Store).reResolve\n\t/go/pkg/mod/github.com/tikv/client-go/v2@v2.0.1/internal/locate/region_cache.go:1944\ngithub.com/tikv/client-go/v2/internal/locate.(*RegionCache).checkAndResolve\n\t/go/pkg/mod/github.com/tikv/client-go/v2@v2.0.1/internal/locate/region_cache.go:453\ngithub.com/tikv/client-go/v2/internal/locate.(*RegionCache).asyncCheckAndResolveLoop\n\t/go/pkg/mod/github.com/tikv/client-go/v2@v2.0.1/internal/locate/region_cache.go:422\nruntime.goexit\n\t/usr/local/go/src/runtime/asm_amd64.s:1581"] [stack="github.com/tikv/client-go/v2/error.Log\n\t/go/pkg/mod/github.com/tikv/client-go/v2@v2.0.1/error/error.go:289\ngithub.com/tikv/client-go/v2/internal/locate.(*RegionCache).checkAndResolve\n\t/go/pkg/mod/github.com/tikv/client-go/v2@v2.0.1/internal/locate/region_cache.go:454\ngithub.com/tikv/client-go/v2/internal/locate.(*RegionCache).asyncCheckAndResolveLoop\n\t/go/pkg/mod/github.com/tikv/client-go/v2@v2.0.1/internal/locate/region_cache.go:422"] [stack="github.com/tikv/client-go/v2/error.Log\n\t/go/pkg/mod/github.com/tikv/client-go/v2@v2.0.1/error/error.go:289\ngithub.com/tikv/client-go/v2/internal/locate.(*RegionCache).checkAndResolve\n\t/go/pkg/mod/github.com/tikv/client-go/v2@v2.0.1/internal/locate/region_cache.go:454\ngithub.com/tikv/client-go/v2/internal/locate.(*RegionCache).asyncCheckAndResolveLoop\n\t/go/pkg/mod/github.com/tikv/client-go/v2@v2.0.1/internal/locate/region_cache.go:422"]
{"level":"warn","ts":"2022-08-30T11:05:47.721+0800","logger":"etcd-client","caller":"v3@v3.5.2/retry_interceptor.go:62","msg":"retrying of unary invoker failed","target":"etcd-endpoints://0xc000818e00/xxxxxxxxxxxxx:12379","attempt":0,"error":"rpc error: code = DeadlineExceeded desc = context deadline exceeded"}
[2022/08/30 11:05:52.842 +08:00] [ERROR] [kv.go:243] ["fail to load safepoint from pd"] [error="context deadline exceeded"] [errorVerbose="context deadline exceeded\ngithub.com/tikv/client-go/v2/tikv.(*EtcdSafePointKV).Get\n\t/go/pkg/mod/github.com/tikv/client-go/v2@v2.0.1/tikv/safepoint.go:148\ngithub.com/tikv/client-go/v2/tikv.loadSafePoint\n\t/go/pkg/mod/github.com/tikv/client-go/v2@v2.0.1/tikv/safepoint.go:183\ngithub.com/tikv/client-go/v2/tikv.(*KVStore).runSafePointChecker\n\t/go/pkg/mod/github.com/tikv/client-go/v2@v2.0.1/tikv/kv.go:236\nruntime.goexit\n\t/usr/local/go/src/runtime/asm_amd64.s:1581"] [stack="github.com/tikv/client-go/v2/tikv.(*KVStore).runSafePointChecker\n\t/go/pkg/mod/github.com/tikv/client-go/v2@v2.0.1/tikv/kv.go:243"]
[2022/08/30 11:05:52.945 +08:00] [ERROR] [base_client.go:144] ["[pd] failed updateMember"] [error="[PD:client:ErrClientGetLeader]get leader from [https://xxxxxxxxxxxxx:12379 https://xxxxxxxxxxxxx:12379 https://xxxxxxxxxxxxx:12379] error"] [stack="github.com/tikv/pd/client.(*baseClient).memberLoop\n\t/go/pkg/mod/github.com/tikv/pd/client@v0.0.0-20220216070739-26c668271201/base_client.go:144"]
[2022/08/30 11:05:53.506 +08:00] [WARN] [client_batch.go:365] ["no available connections"] [target=xxxxxxxxxxxxx:20160]
[2022/08/30 11:05:53.650 +08:00] [WARN] [client_batch.go:365] ["no available connections"] [target=xxxxxxxxxxxxx:20160]
[2022/08/30 11:05:53.717 +08:00] [WARN] [client_batch.go:365] ["no available connections"] [target=xxxxxxxxxxxxx:20160]
[2022/08/30 11:05:54.620 +08:00] [WARN] [client_batch.go:365] ["no available connections"] [target=xxxxxxxxxxxxx:20160]
[2022/08/30 11:05:54.620 +08:00] [WARN] [client_batch.go:365] ["no available connections"] [target=xxxxxxxxxxxxx:20160]
[2022/08/30 11:05:54.620 +08:00] [WARN] [client_batch.go:365] ["no available connections"] [target=xxxxxxxxxxxxx:20160]
[2022/08/30 11:05:54.620 +08:00] [WARN] [client_batch.go:365] ["no available connections"] [target=xxxxxxxxxxxxx:20160]
[2022/08/30 11:05:54.621 +08:00] [WARN] [client_batch.go:365] ["no available connections"] [target=xxxxxxxxxxxxx:20160]
[2022/08/30 11:05:54.702 +08:00] [WARN] [client_batch.go:365] ["no available connections"] [target=xxxxxxxxxxxxx:20160]
[2022/08/30 11:05:54.767 +08:00] [WARN] [client_batch.go:365] ["no available connections"] [target=xxxxxxxxxxxxx:20160]
[2022/08/30 11:05:54.774 +08:00] [WARN] [client_batch.go:365] ["no available connections"] [target=xxxxxxxxxxxxx:20160]
[2022/08/30 11:05:54.797 +08:00] [WARN] [client_batch.go:365] ["no available connections"] [target=xxxxxxxxxxxxx:20160]
[2022/08/30 11:05:54.814 +08:00] [WARN] [client_batch.go:365] ["no available connections"] [target=xxxxxxxxxxxxx:20160]
[2022/08/30 11:05:54.828 +08:00] [WARN] [client_batch.go:365] ["no available connections"] [target=xxxxxxxxxxxxx:20160]
[2022/08/30 11:05:54.847 +08:00] [WARN] [client_batch.go:365] ["no available connections"] [target=xxxxxxxxxxxxx:20160]
[2022/08/30 11:05:54.867 +08:00] [WARN] [client_batch.go:365] ["no available connections"] [target=xxxxxxxxxxxxx:20160]
[2022/08/30 11:05:54.949 +08:00] [WARN] [client_batch.go:365] ["no available connections"] [target=xxxxxxxxxxxxx:20160]
[2022/08/30 11:05:54.997 +08:00] [WARN] [client_batch.go:365] ["no available connections"] [target=xxxxxxxxxxxxx:20160]
[2022/08/30 11:05:55.002 +08:00] [WARN] [client_batch.go:365] ["no available connections"] [target=xxxxxxxxxxxxx:20160]
[2022/08/30 11:05:55.081 +08:00] [WARN] [client_batch.go:365] ["no available connections"] [target=xxxxxxxxxxxxx:20160]
[2022/08/30 11:05:55.113 +08:00] [WARN] [client_batch.go:365] ["no available connections"] [target=xxxxxxxxxxxxx:20160]
[2022/08/30 11:05:55.174 +08:00] [WARN] [client_batch.go:365] ["no available connections"] [target=xxxxxxxxxxxxx:20160]
[2022/08/30 11:05:55.185 +08:00] [WARN] [client_batch.go:365] ["no available connections"] [target=xxxxxxxxxxxxx:20160]
[2022/08/30 11:05:55.225 +08:00] [WARN] [client_batch.go:365] ["no available connections"] [target=xxxxxxxxxxxxx:20160]
[2022/08/30 11:05:55.225 +08:00] [WARN] [client_batch.go:365] ["no available connections"] [target=xxxxxxxxxxxxx:20160]
[2022/08/30 11:05:55.235 +08:00] [WARN] [client_batch.go:365] ["no available connections"] [target=xxxxxxxxxxxxx:20160]
[2022/08/30 11:05:55.384 +08:00] [WARN] [client_batch.go:365] ["no available connections"] [target=xxxxxxxxxxxxx:20160]
[2022/08/30 11:05:55.633 +08:00] [WARN] [client_batch.go:365] ["no available connections"] [target=xxxxxxxxxxxxx:20160]
[2022/08/30 11:05:55.793 +08:00] [WARN] [client_batch.go:365] ["no available connections"] [target=xxxxxxxxxxxxx:20160]
[2022/08/30 11:05:55.845 +08:00] [WARN] [client_batch.go:365] ["no available connections"] [target=xxxxxxxxxxxxx:20160]
[2022/08/30 11:05:55.907 +08:00] [WARN] [client_batch.go:365] ["no available connections"] [target=xxxxxxxxxxxxx:20160]
[2022/08/30 11:05:56.091 +08:00] [WARN] [client_batch.go:365] ["no available connections"] [target=xxxxxxxxxxxxx:20160]
[2022/08/30 11:05:56.211 +08:00] [WARN] [client_batch.go:365] ["no available connections"] [target=xxxxxxxxxxxxx:20160]
[2022/08/30 11:05:56.438 +08:00] [WARN] [client_batch.go:365] ["no available connections"] [target=xxxxxxxxxxxxx:20160]
[2022/08/30 11:05:56.647 +08:00] [WARN] [client_batch.go:365] ["no available connections"] [target=xxxxxxxxxxxxx:20160]
[2022/08/30 11:05:56.647 +08:00] [WARN] [client_batch.go:365] ["no available connections"] [target=xxxxxxxxxxxxx:20160]
[2022/08/30 11:05:56.865 +08:00] [WARN] [client_batch.go:365] ["no available connections"] [target=xxxxxxxxxxxxx:20160]
[2022/08/30 11:05:57.069 +08:00] [WARN] [client_batch.go:365] ["no available connections"] [target=xxxxxxxxxxxxx:20160]
[2022/08/30 11:05:57.184 +08:00] [WARN] [client_batch.go:365] ["no available connections"] [target=xxxxxxxxxxxxx:20160]
[2022/08/30 11:05:57.547 +08:00] [WARN] [client_batch.go:365] ["no available connections"] [target=xxxxxxxxxxxxx:20160]
[2022/08/30 11:05:57.638 +08:00] [WARN] [client_batch.go:365] ["no available connections"] [target=xxxxxxxxxxxxx:20160]
[2022/08/30 11:05:57.769 +08:00] [WARN] [client_batch.go:365] ["no available connections"] [target=xxxxxxxxxxxxx:20160]
[2022/08/30 11:05:57.934 +08:00] [WARN] [client_batch.go:365] ["no available connections"] [target=xxxxxxxxxxxxx:20160]
[2022/08/30 11:05:58.084 +08:00] [WARN] [client_batch.go:365] ["no available connections"] [target=xxxxxxxxxxxxx:20160]
[2022/08/30 11:05:58.199 +08:00] [WARN] [client_batch.go:365] ["no available connections"] [target=xxxxxxxxxxxxx:20160]
[2022/08/30 11:05:58.503 +08:00] [WARN] [client_batch.go:365] ["no available connections"] [target=xxxxxxxxxxxxx:20160]
[2022/08/30 11:05:58.657 +08:00] [WARN] [client_batch.go:365] ["no available connections"] [target=xxxxxxxxxxxxx:20160]
[2022/08/30 11:05:58.893 +08:00] [WARN] [client_batch.go:365] ["no available connections"] [target=xxxxxxxxxxxxx:20160]
[2022/08/30 11:05:59.334 +08:00] [WARN] [client_batch.go:365] ["no available connections"] [target=xxxxxxxxxxxxx:20160]
[2022/08/30 11:05:59.739 +08:00] [WARN] [client_batch.go:365] ["no available connections"] [target=xxxxxxxxxxxxx:20160]
[2022/08/30 11:06:00.135 +08:00] [WARN] [client_batch.go:365] ["no available connections"] [target=xxxxxxxxxxxxx:20160]
[2022/08/30 11:06:00.669 +08:00] [WARN] [client_batch.go:365] ["no available connections"] [target=xxxxxxxxxxxxx:20160]
[2022/08/30 11:06:00.936 +08:00] [WARN] [client_batch.go:365] ["no available connections"] [target=xxxxxxxxxxxxx:20160]
[2022/08/30 11:06:01.700 +08:00] [WARN] [client_batch.go:365] ["no available connections"] [target=xxxxxxxxxxxxx:20160]
[2022/08/30 11:06:01.779 +08:00] [WARN] [client_batch.go:365] ["no available connections"] [target=xxxxxxxxxxxxx:20160]
[2022/08/30 11:06:02.260 +08:00] [WARN] [client_batch.go:365] ["no available connections"] [target=xxxxxxxxxxxxx:20160]
[2022/08/30 11:06:02.447 +08:00] [WARN] [client_batch.go:365] ["no available connections"] [target=xxxxxxxxxxxxx:20160]
[2022/08/30 11:06:03.524 +08:00] [WARN] [client_batch.go:365] ["no available connections"] [target=xxxxxxxxxxxxx:20160]
[2022/08/30 11:06:03.616 +08:00] [WARN] [client_batch.go:365] ["no available connections"] [target=xxxxxxxxxxxxx:20160]
[2022/08/30 11:06:03.659 +08:00] [WARN] [client_batch.go:365] ["no available connections"] [target=xxxxxxxxxxxxx:20160]
[2022/08/30 11:06:03.869 +08:00] [WARN] [client_batch.go:365] ["no available connections"] [target=xxxxxxxxxxxxx:20160]
[2022/08/30 11:06:03.902 +08:00] [WARN] [client_batch.go:365] ["no available connections"] [target=xxxxxxxxxxxxx:20160]
[2022/08/30 11:06:04.075 +08:00] [WARN] [client_batch.go:365] ["no available connections"] [target=xxxxxxxxxxxxx:20160]
[2022/08/30 11:06:04.299 +08:00] [WARN] [client_batch.go:365] ["no available connections"] [target=xxxxxxxxxxxxx:20160]
[2022/08/30 11:06:04.445 +08:00] [WARN] [client_batch.go:365] ["no available connections"] [target=xxxxxxxxxxxxx:20160]
[2022/08/30 11:06:04.999 +08:00] [WARN] [client_batch.go:365] ["no available connections"] [target=xxxxxxxxxxxxx:20160]
[2022/08/30 11:06:05.230 +08:00] [WARN] [client_batch.go:365] ["no available connections"] [target=xxxxxxxxxxxxx:20160]
[2022/08/30 11:06:20.493 +08:00] [ERROR] [client.go:528] ["[pd] tso request is canceled due to timeout"] [dc-location=global] [error="[PD:client:ErrClientGetTSOTimeout]get TSO timeout"] [stack="github.com/tikv/pd/client.(*client).watchTSDeadline.func1\n\t/go/pkg/mod/github.com/tikv/pd/client@v0.0.0-20220216070739-26c668271201/client.go:528"]
[2022/08/30 11:06:20.502 +08:00] [ERROR] [client.go:833] ["[pd] getTS error"] [dc-location=global] [stream-addr=https://xxxxxxxxxxxxx:12379] [error="[PD:client:ErrClientGetTSO]rpc error: code = Canceled desc = context canceled: rpc error: code = Canceled desc = context canceled"] [stack="github.com/tikv/pd/client.(*client).handleDispatcher\n\t/go/pkg/mod/github.com/tikv/pd/client@v0.0.0-20220216070739-26c668271201/client.go:833"]
[2022/08/30 11:06:20.503 +08:00] [ERROR] [pd.go:236] ["updateTS error"] [txnScope=global] [error="rpc error: code = Canceled desc = context canceled"] [errorVerbose="rpc error: code = Canceled desc = context canceled\ngithub.com/tikv/pd/client.(*client).processTSORequests\n\t/go/pkg/mod/github.com/tikv/pd/client@v0.0.0-20220216070739-26c668271201/client.go:1067\ngithub.com/tikv/pd/client.(*client).handleDispatcher\n\t/go/pkg/mod/github.com/tikv/pd/client@v0.0.0-20220216070739-26c668271201/client.go:823\nruntime.goexit\n\t/usr/local/go/src/runtime/asm_amd64.s:1581\ngithub.com/tikv/pd/client.(*tsoRequest).Wait\n\t/go/pkg/mod/github.com/tikv/pd/client@v0.0.0-20220216070739-26c668271201/client.go:1283\ngithub.com/tikv/pd/client.(*client).GetTS\n\t/go/pkg/mod/github.com/tikv/pd/client@v0.0.0-20220216070739-26c668271201/client.go:1303\ngithub.com/tikv/client-go/v2/util.InterceptedPDClient.GetTS\n\t/go/pkg/mod/github.com/tikv/client-go/v2@v2.0.1/util/pd_interceptor.go:81\ngithub.com/tikv/client-go/v2/oracle/oracles.(*pdOracle).getTimestamp\n\t/go/pkg/mod/github.com/tikv/client-go/v2@v2.0.1/oracle/oracles/pd.go:143\ngithub.com/tikv/client-go/v2/oracle/oracles.(*pdOracle).updateTS.func1\n\t/go/pkg/mod/github.com/tikv/client-go/v2@v2.0.1/oracle/oracles/pd.go:234\nsync.(*Map).Range\n\t/usr/local/go/src/sync/map.go:346\ngithub.com/tikv/client-go/v2/oracle/oracles.(*pdOracle).updateTS\n\t/go/pkg/mod/github.com/tikv/client-go/v2@v2.0.1/oracle/oracles/pd.go:232\nruntime.goexit\n\t/usr/local/go/src/runtime/asm_amd64.s:1581\ngithub.com/tikv/client-go/v2/oracle/oracles.(*pdOracle).getTimestamp\n\t/go/pkg/mod/github.com/tikv/client-go/v2@v2.0.1/oracle/oracles/pd.go:148\ngithub.com/tikv/client-go/v2/oracle/oracles.(*pdOracle).updateTS.func1\n\t/go/pkg/mod/github.com/tikv/client-go/v2@v2.0.1/oracle/oracles/pd.go:234\nsync.(*Map).Range\n\t/usr/local/go/src/sync/map.go:346\ngithub.com/tikv/client-go/v2/oracle/oracles.(*pdOracle).updateTS\n\t/go/pkg/mod/github.com/tikv/client-go/v2@v2.0.1/oracle/oracles/pd.go:232\nruntime.goexit\n\t/usr/local/go/src/runtime/asm_amd64.s:1581"] [stack="github.com/tikv/client-go/v2/oracle/oracles.(*pdOracle).updateTS.func1\n\t/go/pkg/mod/github.com/tikv/client-go/v2@v2.0.1/oracle/oracles/pd.go:236\nsync.(*Map).Range\n\t/usr/local/go/src/sync/map.go:346\ngithub.com/tikv/client-go/v2/oracle/oracles.(*pdOracle).updateTS\n\t/go/pkg/mod/github.com/tikv/client-go/v2@v2.0.1/oracle/oracles/pd.go:232"]
[2022/08/30 11:06:24.259 +08:00] [WARN] [pd.go:152] ["get timestamp too slow"] ["cost time"=3.750027658s]
[2022/08/30 11:06:24.258 +08:00] [WARN] [pd.go:152] ["get timestamp too slow"] ["cost time"=4.721480334s]
[2022/08/30 11:06:24.259 +08:00] [WARN] [pd.go:152] ["get timestamp too slow"] ["cost time"=2.885650636s]
[2022/08/30 11:06:24.259 +08:00] [WARN] [pd.go:152] ["get timestamp too slow"] ["cost time"=150.771102ms]
[2022/08/30 11:06:24.259 +08:00] [WARN] [pd.go:152] ["get timestamp too slow"] ["cost time"=299.389945ms]
[2022/08/30 11:06:27.940 +08:00] [WARN] [pd.go:152] ["get timestamp too slow"] ["cost time"=2.439063186s]
[2022/08/30 11:08:45.064 +08:00] [ERROR] [client.go:528] ["[pd] tso request is canceled due to timeout"] [dc-location=global] [error="[PD:client:ErrClientGetTSOTimeout]get TSO timeout"] [stack="github.com/tikv/pd/client.(*client).watchTSDeadline.func1\n\t/go/pkg/mod/github.com/tikv/pd/client@v0.0.0-20220216070739-26c668271201/client.go:528"]
[2022/08/30 11:08:48.240 +08:00] [ERROR] [region_cache.go:1954] ["loadStore from PD failed"] [id=1] [error="rpc error: code = DeadlineExceeded desc = context deadline exceeded"] [errorVerbose="rpc error: code = DeadlineExceeded desc = context deadline exceeded\ngithub.com/tikv/pd/client.(*client).GetStore\n\t/go/pkg/mod/github.com/tikv/pd/client@v0.0.0-20220216070739-26c668271201/client.go:1524\ngithub.com/tikv/client-go/v2/util.InterceptedPDClient.GetStore\n\t/go/pkg/mod/github.com/tikv/client-go/v2@v2.0.1/util/pd_interceptor.go:132\ngithub.com/tikv/client-go/v2/internal/locate.(*Store).reResolve\n\t/go/pkg/mod/github.com/tikv/client-go/v2@v2.0.1/internal/locate/region_cache.go:1944\ngithub.com/tikv/client-go/v2/internal/locate.(*RegionCache).checkAndResolve\n\t/go/pkg/mod/github.com/tikv/client-go/v2@v2.0.1/internal/locate/region_cache.go:453\ngithub.com/tikv/client-go/v2/internal/locate.(*RegionCache).asyncCheckAndResolveLoop\n\t/go/pkg/mod/github.com/tikv/client-go/v2@v2.0.1/internal/locate/region_cache.go:422\nruntime.goexit\n\t/usr/local/go/src/runtime/asm_amd64.s:1581"] [stack="github.com/tikv/client-go/v2/internal/locate.(*Store).reResolve\n\t/go/pkg/mod/github.com/tikv/client-go/v2@v2.0.1/internal/locate/region_cache.go:1954\ngithub.com/tikv/client-go/v2/internal/locate.(*RegionCache).checkAndResolve\n\t/go/pkg/mod/github.com/tikv/client-go/v2@v2.0.1/internal/locate/region_cache.go:453\ngithub.com/tikv/client-go/v2/internal/locate.(*RegionCache).asyncCheckAndResolveLoop\n\t/go/pkg/mod/github.com/tikv/client-go/v2@v2.0.1/internal/locate/region_cache.go:422"]
[2022/08/30 11:08:48.241 +08:00] [ERROR] [error.go:289] ["encountered error"] [error="rpc error: code = DeadlineExceeded desc = context deadline exceeded"] [errorVerbose="rpc error: code = DeadlineExceeded desc = context deadline exceeded\ngithub.com/tikv/pd/client.(*client).GetStore\n\t/go/pkg/mod/github.com/tikv/pd/client@v0.0.0-20220216070739-26c668271201/client.go:1524\ngithub.com/tikv/client-go/v2/util.InterceptedPDClient.GetStore\n\t/go/pkg/mod/github.com/tikv/client-go/v2@v2.0.1/util/pd_interceptor.go:132\ngithub.com/tikv/client-go/v2/internal/locate.(*Store).reResolve\n\t/go/pkg/mod/github.com/tikv/client-go/v2@v2.0.1/internal/locate/region_cache.go:1944\ngithub.com/tikv/client-go/v2/internal/locate.(*RegionCache).checkAndResolve\n\t/go/pkg/mod/github.com/tikv/client-go/v2@v2.0.1/internal/locate/region_cache.go:453\ngithub.com/tikv/client-go/v2/internal/locate.(*RegionCache).asyncCheckAndResolveLoop\n\t/go/pkg/mod/github.com/tikv/client-go/v2@v2.0.1/internal/locate/region_cache.go:422\nruntime.goexit\n\t/usr/local/go/src/runtime/asm_amd64.s:1581"] [stack="github.com/tikv/client-go/v2/error.Log\n\t/go/pkg/mod/github.com/tikv/client-go/v2@v2.0.1/error/error.go:289\ngithub.com/tikv/client-go/v2/internal/locate.(*RegionCache).checkAndResolve\n\t/go/pkg/mod/github.com/tikv/client-go/v2@v2.0.1/internal/locate/region_cache.go:454\ngithub.com/tikv/client-go/v2/internal/locate.(*RegionCache).asyncCheckAndResolveLoop\n\t/go/pkg/mod/github.com/tikv/client-go/v2@v2.0.1/internal/locate/region_cache.go:422"] [stack="github.com/tikv/client-go/v2/error.Log\n\t/go/pkg/mod/github.com/tikv/client-go/v2@v2.0.1/error/error.go:289\ngithub.com/tikv/client-go/v2/internal/locate.(*RegionCache).checkAndResolve\n\t/go/pkg/mod/github.com/tikv/client-go/v2@v2.0.1/internal/locate/region_cache.go:454\ngithub.com/tikv/client-go/v2/internal/locate.(*RegionCache).asyncCheckAndResolveLoop\n\t/go/pkg/mod/github.com/tikv/client-go/v2@v2.0.1/internal/locate/region_cache.go:422"]
{"level":"warn","ts":"2022-08-30T11:08:52.232+0800","logger":"etcd-client","caller":"v3@v3.5.2/retry_interceptor.go:62","msg":"retrying of unary invoker failed","target":"etcd-endpoints://0xc000818e00/xxxxxxxxxxxxx:12379","attempt":0,"error":"rpc error: code = DeadlineExceeded desc = context deadline exceeded"}
[2022/08/30 11:08:52.233 +08:00] [ERROR] [kv.go:243] ["fail to load safepoint from pd"] [error="context deadline exceeded"] [errorVerbose="context deadline exceeded\ngithub.com/tikv/client-go/v2/tikv.(*EtcdSafePointKV).Get\n\t/go/pkg/mod/github.com/tikv/client-go/v2@v2.0.1/tikv/safepoint.go:148\ngithub.com/tikv/client-go/v2/tikv.loadSafePoint\n\t/go/pkg/mod/github.com/tikv/client-go/v2@v2.0.1/tikv/safepoint.go:183\ngithub.com/tikv/client-go/v2/tikv.(*KVStore).runSafePointChecker\n\t/go/pkg/mod/github.com/tikv/client-go/v2@v2.0.1/tikv/kv.go:236\nruntime.goexit\n\t/usr/local/go/src/runtime/asm_amd64.s:1581"] [stack="github.com/tikv/client-go/v2/tikv.(*KVStore).runSafePointChecker\n\t/go/pkg/mod/github.com/tikv/client-go/v2@v2.0.1/tikv/kv.go:243"]
[2022/08/30 11:10:39.711 +08:00] [WARN] [pd.go:152] ["get timestamp too slow"] ["cost time"=3m56.540992443s]
{"level":"warn","ts":"2022-08-30T11:10:42.100+0800","logger":"etcd-client","caller":"v3@v3.5.2/retry_interceptor.go:62","msg":"retrying of unary invoker failed","target":"etcd-endpoints://0xc000818e00/xxxxxxxxxxxxx:12379","attempt":0,"error":"rpc error: code = DeadlineExceeded desc = context deadline exceeded"}
{"level":"info","ts":"2022-08-30T11:10:42.105+0800","logger":"etcd-client","caller":"v3@v3.5.2/client.go:207","msg":"Auto sync endpoints failed.","error":"context deadline exceeded"}
[2022/08/30 11:11:01.072 +08:00] [ERROR] [base_client.go:144] ["[pd] failed updateMember"] [error="[PD:client:ErrClientGetLeader]get leader from [https://xxxxxxxxxxxxx:12379 https://xxxxxxxxxxxxx:12379 https://xxxxxxxxxxxxx:12379] error"] [stack="github.com/tikv/pd/client.(*baseClient).memberLoop\n\t/go/pkg/mod/github.com/tikv/pd/client@v0.0.0-20220216070739-26c668271201/base_client.go:144"]
{"level":"warn","ts":"2022-08-30T11:11:05.733+0800","logger":"etcd-client","caller":"v3@v3.5.2/retry_interceptor.go:62","msg":"retrying of unary invoker failed","target":"etcd-endpoints://0xc000818e00/xxxxxxxxxxxxx:12379","attempt":0,"error":"rpc error: code = DeadlineExceeded desc = context deadline exceeded"}
[2022/08/30 11:11:33.145 +08:00] [ERROR] [base_client.go:144] ["[pd] failed updateMember"] [error="[PD:client:ErrClientGetLeader]get leader from [https://xxxxxxxxxxxxx:12379 https://xxxxxxxxxxxxx:12379 https://xxxxxxxxxxxxx:12379] error"] [stack="github.com/tikv/pd/client.(*baseClient).memberLoop\n\t/go/pkg/mod/github.com/tikv/pd/client@v0.0.0-20220216070739-26c668271201/base_client.go:144"]
{"level":"warn","ts":"2022-08-30T11:11:29.021+0800","logger":"etcd-client","caller":"v3@v3.5.2/retry_interceptor.go:62","msg":"retrying of unary invoker failed","target":"etcd-endpoints://0xc000818e00/xxxxxxxxxxxxx:12379","attempt":0,"error":"rpc error: code = DeadlineExceeded desc = context deadline exceeded"}
{"level":"info","ts":"2022-08-30T11:11:38.527+0800","logger":"etcd-client","caller":"v3@v3.5.2/client.go:207","msg":"Auto sync endpoints failed.","error":"context deadline exceeded"}
[2022/08/30 11:11:32.576 +08:00] [ERROR] [kv.go:243] ["fail to load safepoint from pd"] [error="context deadline exceeded"] [errorVerbose="context deadline exceeded\ngithub.com/tikv/client-go/v2/tikv.(*EtcdSafePointKV).Get\n\t/go/pkg/mod/github.com/tikv/client-go/v2@v2.0.1/tikv/safepoint.go:148\ngithub.com/tikv/client-go/v2/tikv.loadSafePoint\n\t/go/pkg/mod/github.com/tikv/client-go/v2@v2.0.1/tikv/safepoint.go:183\ngithub.com/tikv/client-go/v2/tikv.(*KVStore).runSafePointChecker\n\t/go/pkg/mod/github.com/tikv/client-go/v2@v2.0.1/tikv/kv.go:236\nruntime.goexit\n\t/usr/local/go/src/runtime/asm_amd64.s:1581"] [stack="github.com/tikv/client-go/v2/tikv.(*KVStore).runSafePointChecker\n\t/go/pkg/mod/github.com/tikv/client-go/v2@v2.0.1/tikv/kv.go:243"]
[2022/08/30 11:11:55.644 +08:00] [ERROR] [region_cache.go:1954] ["loadStore from PD failed"] [id=2] [error="rpc error: code = DeadlineExceeded desc = context deadline exceeded"] [errorVerbose="rpc error: code = DeadlineExceeded desc = context deadline exceeded\ngithub.com/tikv/pd/client.(*client).GetStore\n\t/go/pkg/mod/github.com/tikv/pd/client@v0.0.0-20220216070739-26c668271201/client.go:1524\ngithub.com/tikv/client-go/v2/util.InterceptedPDClient.GetStore\n\t/go/pkg/mod/github.com/tikv/client-go/v2@v2.0.1/util/pd_interceptor.go:132\ngithub.com/tikv/client-go/v2/internal/locate.(*Store).reResolve\n\t/go/pkg/mod/github.com/tikv/client-go/v2@v2.0.1/internal/locate/region_cache.go:1944\ngithub.com/tikv/client-go/v2/internal/locate.(*RegionCache).checkAndResolve\n\t/go/pkg/mod/github.com/tikv/client-go/v2@v2.0.1/internal/locate/region_cache.go:453\ngithub.com/tikv/client-go/v2/internal/locate.(*RegionCache).asyncCheckAndResolveLoop\n\t/go/pkg/mod/github.com/tikv/client-go/v2@v2.0.1/internal/locate/region_cache.go:422\nruntime.goexit\n\t/usr/local/go/src/runtime/asm_amd64.s:1581"] [stack="github.com/tikv/client-go/v2/internal/locate.(*Store).reResolve\n\t/go/pkg/mod/github.com/tikv/client-go/v2@v2.0.1/internal/locate/region_cache.go:1954\ngithub.com/tikv/client-go/v2/internal/locate.(*RegionCache).checkAndResolve\n\t/go/pkg/mod/github.com/tikv/client-go/v2@v2.0.1/internal/locate/region_cache.go:453\ngithub.com/tikv/client-go/v2/internal/locate.(*RegionCache).asyncCheckAndResolveLoop\n\t/go/pkg/mod/github.com/tikv/client-go/v2@v2.0.1/internal/locate/region_cache.go:422"]
{"level":"warn","ts":"2022-08-30T11:12:48.356+0800","logger":"etcd-client","caller":"v3@v3.5.2/retry_interceptor.go:62","msg":"retrying of unary invoker failed","target":"etcd-endpoints://0xc000818e00/xxxxxxxxxxxxx:12379","attempt":0,"error":"rpc error: code = DeadlineExceeded desc = context deadline exceeded"}
[2022/08/30 11:12:33.876 +08:00] [ERROR] [error.go:289] ["encountered error"] [error="rpc error: code = DeadlineExceeded desc = context deadline exceeded"] [errorVerbose="rpc error: code = DeadlineExceeded desc = context deadline exceeded\ngithub.com/tikv/pd/client.(*client).GetStore\n\t/go/pkg/mod/github.com/tikv/pd/client@v0.0.0-20220216070739-26c668271201/client.go:1524\ngithub.com/tikv/client-go/v2/util.InterceptedPDClient.GetStore\n\t/go/pkg/mod/github.com/tikv/client-go/v2@v2.0.1/util/pd_interceptor.go:132\ngithub.com/tikv/client-go/v2/internal/locate.(*Store).reResolve\n\t/go/pkg/mod/github.com/tikv/client-go/v2@v2.0.1/internal/locate/region_cache.go:1944\ngithub.com/tikv/client-go/v2/internal/locate.(*RegionCache).checkAndResolve\n\t/go/pkg/mod/github.com/tikv/client-go/v2@v2.0.1/internal/locate/region_cache.go:453\ngithub.com/tikv/client-go/v2/internal/locate.(*RegionCache).asyncCheckAndResolveLoop\n\t/go/pkg/mod/github.com/tikv/client-go/v2@v2.0.1/internal/locate/region_cache.go:422\nruntime.goexit\n\t/usr/local/go/src/runtime/asm_amd64.s:1581"] [stack="github.com/tikv/client-go/v2/error.Log\n\t/go/pkg/mod/github.com/tikv/client-go/v2@v2.0.1/error/error.go:289\ngithub.com/tikv/client-go/v2/internal/locate.(*RegionCache).checkAndResolve\n\t/go/pkg/mod/github.com/tikv/client-go/v2@v2.0.1/internal/locate/region_cache.go:454\ngithub.com/tikv/client-go/v2/internal/locate.(*RegionCache).asyncCheckAndResolveLoop\n\t/go/pkg/mod/github.com/tikv/client-go/v2@v2.0.1/internal/locate/region_cache.go:422"] [stack="github.com/tikv/client-go/v2/error.Log\n\t/go/pkg/mod/github.com/tikv/client-go/v2@v2.0.1/error/error.go:289\ngithub.com/tikv/client-go/v2/internal/locate.(*RegionCache).checkAndResolve\n\t/go/pkg/mod/github.com/tikv/client-go/v2@v2.0.1/internal/locate/region_cache.go:454\ngithub.com/tikv/client-go/v2/internal/locate.(*RegionCache).asyncCheckAndResolveLoop\n\t/go/pkg/mod/github.com/tikv/client-go/v2@v2.0.1/internal/locate/region_cache.go:422"]
{"level":"warn","ts":"2022-08-30T11:14:09.439+0800","logger":"etcd-client","caller":"v3@v3.5.2/retry_interceptor.go:62","msg":"retrying of unary invoker failed","target":"etcd-endpoints://0xc000818e00/xxxxxxxxxxxxx:12379","attempt":0,"error":"rpc error: code = DeadlineExceeded desc = context deadline exceeded"}
{"level":"info","ts":"2022-08-30T11:14:09.442+0800","logger":"etcd-client","caller":"v3@v3.5.2/client.go:207","msg":"Auto sync endpoints failed.","error":"context deadline exceeded"}
[2022/08/30 11:14:09.443 +08:00] [ERROR] [kv.go:243] ["fail to load safepoint from pd"] [error="context deadline exceeded"] [errorVerbose="context deadline exceeded\ngithub.com/tikv/client-go/v2/tikv.(*EtcdSafePointKV).Get\n\t/go/pkg/mod/github.com/tikv/client-go/v2@v2.0.1/tikv/safepoint.go:148\ngithub.com/tikv/client-go/v2/tikv.loadSafePoint\n\t/go/pkg/mod/github.com/tikv/client-go/v2@v2.0.1/tikv/safepoint.go:183\ngithub.com/tikv/client-go/v2/tikv.(*KVStore).runSafePointChecker\n\t/go/pkg/mod/github.com/tikv/client-go/v2@v2.0.1/tikv/kv.go:236\nruntime.goexit\n\t/usr/local/go/src/runtime/asm_amd64.s:1581"] [stack="github.com/tikv/client-go/v2/tikv.(*KVStore).runSafePointChecker\n\t/go/pkg/mod/github.com/tikv/client-go/v2@v2.0.1/tikv/kv.go:243"]
2022/08/30 11:14:09.594511 juicefs[176388] <WARNING>: Get counter usedSpace: start timestamp may fall behind safe point [base.go:342]
[2022/08/30 11:14:09.799 +08:00] [WARN] [prewrite.go:222] ["slow prewrite request"] [startTS=435638444810043443] [region="{ region id: 104, ver: 8, confVer: 5 }"] [attempts=3]
[2022/08/30 11:14:09.801 +08:00] [ERROR] [2pc.go:1418] ["2PC commit result undetermined"] [error="write conflict { start_ts:435638444810043443 conflict_ts:435638444810043443 key:\"file-meta\\375SE\\000\\000\\000\\000\\000\\000\\000v\" primary:\"file-meta\\375SE\\000\\000\\000\\000\\000\\000\\000v\" conflict_commit_ts:435638444810043443 }"] [errorVerbose="write conflict { start_ts:435638444810043443 conflict_ts:435638444810043443 key:\"file-meta\\375SE\\000\\000\\000\\000\\000\\000\\000v\" primary:\"file-meta\\375SE\\000\\000\\000\\000\\000\\000\\000v\" conflict_commit_ts:435638444810043443 }\ngithub.com/tikv/client-go/v2/error.ExtractKeyErr\n\t/go/pkg/mod/github.com/tikv/client-go/v2@v2.0.1/error/error.go:253\ngithub.com/tikv/client-go/v2/txnkv/txnlock.ExtractLockFromKeyErr\n\t/go/pkg/mod/github.com/tikv/client-go/v2@v2.0.1/txnkv/txnlock/lock.go:27\ngithub.com/tikv/client-go/v2/txnkv/transaction.actionPrewrite.handleSingleBatch\n\t/go/pkg/mod/github.com/tikv/client-go/v2@v2.0.1/txnkv/transaction/prewrite.go:343\ngithub.com/tikv/client-go/v2/txnkv/transaction.(*twoPhaseCommitter).doActionOnBatches\n\t/go/pkg/mod/github.com/tikv/client-go/v2@v2.0.1/txnkv/transaction/2pc.go:982\ngithub.com/tikv/client-go/v2/txnkv/transaction.(*twoPhaseCommitter).doActionOnGroupMutations\n\t/go/pkg/mod/github.com/tikv/client-go/v2@v2.0.1/txnkv/transaction/2pc.go:963\ngithub.com/tikv/client-go/v2/txnkv/transaction.(*twoPhaseCommitter).doActionOnMutations\n\t/go/pkg/mod/github.com/tikv/client-go/v2@v2.0.1/txnkv/transaction/2pc.go:740\ngithub.com/tikv/client-go/v2/txnkv/transaction.(*twoPhaseCommitter).prewriteMutations\n\t/go/pkg/mod/github.com/tikv/client-go/v2@v2.0.1/txnkv/transaction/prewrite.go:384\ngithub.com/tikv/client-go/v2/txnkv/transaction.(*twoPhaseCommitter).execute\n\t/go/pkg/mod/github.com/tikv/client-go/v2@v2.0.1/txnkv/transaction/2pc.go:1407\ngithub.com/tikv/client-go/v2/txnkv/transaction.(*KVTxn).Commit\n\t/go/pkg/mod/github.com/tikv/client-go/v2@v2.0.1/txnkv/transaction/txn.go:436\ngithub.com/juicedata/juicefs/pkg/meta.(*tikvClient).txn\n\t/go/src/github.com/juicedata/juicefs/pkg/meta/tkv_tikv.go:232\ngithub.com/juicedata/juicefs/pkg/meta.(*prefixClient).txn\n\t/go/src/github.com/juicedata/juicefs/pkg/meta/tkv_prefix.go:108\ngithub.com/juicedata/juicefs/pkg/meta.(*kvMeta).txn\n\t/go/src/github.com/juicedata/juicefs/pkg/meta/tkv.go:640\ngithub.com/juicedata/juicefs/pkg/meta.(*kvMeta).setValue\n\t/go/src/github.com/juicedata/juicefs/pkg/meta/tkv.go:660\ngithub.com/juicedata/juicefs/pkg/meta.(*kvMeta).doRefreshSession\n\t/go/src/github.com/juicedata/juicefs/pkg/meta/tkv.go:403\ngithub.com/juicedata/juicefs/pkg/meta.(*baseMeta).refreshSession\n\t/go/src/github.com/juicedata/juicefs/pkg/meta/base.go:289\nruntime.goexit\n\t/usr/local/go/src/runtime/asm_amd64.s:1581"] [rpcErr="rpcClient is idle"] [rpcErrVerbose="rpcClient is idle\ngithub.com/tikv/client-go/v2/internal/client.(*RPCClient).getConnArray\n\t/go/pkg/mod/github.com/tikv/client-go/v2@v2.0.1/internal/client/client.go:304\ngithub.com/tikv/client-go/v2/internal/client.(*RPCClient).SendRequest\n\t/go/pkg/mod/github.com/tikv/client-go/v2@v2.0.1/internal/client/client.go:381\ngithub.com/tikv/client-go/v2/internal/client.interceptedClient.SendRequest\n\t/go/pkg/mod/github.com/tikv/client-go/v2@v2.0.1/internal/client/client_interceptor.go:42\ngithub.com/tikv/client-go/v2/internal/client.reqCollapse.SendRequest\n\t/go/pkg/mod/github.com/tikv/client-go/v2@v2.0.1/internal/client/client_collapse.go:74\ngithub.com/tikv/client-go/v2/internal/locate.(*RegionRequestSender).sendReqToRegion\n\t/go/pkg/mod/github.com/tikv/client-go/v2@v2.0.1/internal/locate/region_request.go:1130\ngithub.com/tikv/client-go/v2/internal/locate.(*RegionRequestSender).SendReqCtx\n\t/go/pkg/mod/github.com/tikv/client-go/v2@v2.0.1/internal/locate/region_request.go:982\ngithub.com/tikv/client-go/v2/internal/locate.(*RegionRequestSender).SendReq\n\t/go/pkg/mod/github.com/tikv/client-go/v2@v2.0.1/internal/locate/region_request.go:231\ngithub.com/tikv/client-go/v2/txnkv/transaction.actionPrewrite.handleSingleBatch\n\t/go/pkg/mod/github.com/tikv/client-go/v2@v2.0.1/txnkv/transaction/prewrite.go:226\ngithub.com/tikv/client-go/v2/txnkv/transaction.(*twoPhaseCommitter).doActionOnBatches\n\t/go/pkg/mod/github.com/tikv/client-go/v2@v2.0.1/txnkv/transaction/2pc.go:982\ngithub.com/tikv/client-go/v2/txnkv/transaction.(*twoPhaseCommitter).doActionOnGroupMutations\n\t/go/pkg/mod/github.com/tikv/client-go/v2@v2.0.1/txnkv/transaction/2pc.go:963\ngithub.com/tikv/client-go/v2/txnkv/transaction.(*twoPhaseCommitter).doActionOnMutations\n\t/go/pkg/mod/github.com/tikv/client-go/v2@v2.0.1/txnkv/transaction/2pc.go:740\ngithub.com/tikv/client-go/v2/txnkv/transaction.(*twoPhaseCommitter).prewriteMutations\n\t/go/pkg/mod/github.com/tikv/client-go/v2@v2.0.1/txnkv/transaction/prewrite.go:384\ngithub.com/tikv/client-go/v2/txnkv/transaction.(*twoPhaseCommitter).execute\n\t/go/pkg/mod/github.com/tikv/client-go/v2@v2.0.1/txnkv/transaction/2pc.go:1407\ngithub.com/tikv/client-go/v2/txnkv/transaction.(*KVTxn).Commit\n\t/go/pkg/mod/github.com/tikv/client-go/v2@v2.0.1/txnkv/transaction/txn.go:436\ngithub.com/juicedata/juicefs/pkg/meta.(*tikvClient).txn\n\t/go/src/github.com/juicedata/juicefs/pkg/meta/tkv_tikv.go:232\ngithub.com/juicedata/juicefs/pkg/meta.(*prefixClient).txn\n\t/go/src/github.com/juicedata/juicefs/pkg/meta/tkv_prefix.go:108\ngithub.com/juicedata/juicefs/pkg/meta.(*kvMeta).txn\n\t/go/src/github.com/juicedata/juicefs/pkg/meta/tkv.go:640\ngithub.com/juicedata/juicefs/pkg/meta.(*kvMeta).setValue\n\t/go/src/github.com/juicedata/juicefs/pkg/meta/tkv.go:660\ngithub.com/juicedata/juicefs/pkg/meta.(*kvMeta).doRefreshSession\n\t/go/src/github.com/juicedata/juicefs/pkg/meta/tkv.go:403\ngithub.com/juicedata/juicefs/pkg/meta.(*baseMeta).refreshSession\n\t/go/src/github.com/juicedata/juicefs/pkg/meta/base.go:289\nruntime.goexit\n\t/usr/local/go/src/runtime/asm_amd64.s:1581"] [txnStartTS=435638444810043443] [stack="github.com/tikv/client-go/v2/txnkv/transaction.(*twoPhaseCommitter).execute\n\t/go/pkg/mod/github.com/tikv/client-go/v2@v2.0.1/txnkv/transaction/2pc.go:1418\ngithub.com/tikv/client-go/v2/txnkv/transaction.(*KVTxn).Commit\n\t/go/pkg/mod/github.com/tikv/client-go/v2@v2.0.1/txnkv/transaction/txn.go:436\ngithub.com/juicedata/juicefs/pkg/meta.(*tikvClient).txn\n\t/go/src/github.com/juicedata/juicefs/pkg/meta/tkv_tikv.go:232\ngithub.com/juicedata/juicefs/pkg/meta.(*prefixClient).txn\n\t/go/src/github.com/juicedata/juicefs/pkg/meta/tkv_prefix.go:108\ngithub.com/juicedata/juicefs/pkg/meta.(*kvMeta).txn\n\t/go/src/github.com/juicedata/juicefs/pkg/meta/tkv.go:640\ngithub.com/juicedata/juicefs/pkg/meta.(*kvMeta).setValue\n\t/go/src/github.com/juicedata/juicefs/pkg/meta/tkv.go:660\ngithub.com/juicedata/juicefs/pkg/meta.(*kvMeta).doRefreshSession\n\t/go/src/github.com/juicedata/juicefs/pkg/meta/tkv.go:403\ngithub.com/juicedata/juicefs/pkg/meta.(*baseMeta).refreshSession\n\t/go/src/github.com/juicedata/juicefs/pkg/meta/base.go:289"]
[2022/08/30 11:14:11.440 +08:00] [WARN] [pd.go:152] ["get timestamp too slow"] ["cost time"=4m11.43245154s]
[2022/08/30 11:14:11.441 +08:00] [WARN] [pd.go:152] ["get timestamp too slow"] ["cost time"=1.638016042s]
[2022/08/30 11:14:11.441 +08:00] [WARN] [pd.go:152] ["get timestamp too slow"] ["cost time"=1.845167782s]
[2022/08/30 11:14:11.440 +08:00] [WARN] [pd.go:152] ["get timestamp too slow"] ["cost time"=5m26.376847241s]
[2022/08/30 11:14:11.440 +08:00] [WARN] [pd.go:152] ["get timestamp too slow"] ["cost time"=3m31.725251512s]
[2022/08/30 11:14:11.441 +08:00] [WARN] [pd.go:152] ["get timestamp too slow"] ["cost time"=1.854664637s]
[2022/08/30 11:14:11.441 +08:00] [WARN] [pd.go:152] ["get timestamp too slow"] ["cost time"=3m28.496974883s]
[2022/08/30 11:14:11.441 +08:00] [WARN] [pd.go:152] ["get timestamp too slow"] ["cost time"=2m15.781783726s]
[2022/08/30 11:14:11.441 +08:00] [WARN] [pd.go:152] ["get timestamp too slow"] ["cost time"=1.997841354s]
[2022/08/30 11:14:11.441 +08:00] [WARN] [pd.go:152] ["get timestamp too slow"] ["cost time"=1m25.652050203s]
[2022/08/30 11:14:11.440 +08:00] [WARN] [pd.go:152] ["get timestamp too slow"] ["cost time"=3m53.448052934s]
[2022/08/30 11:14:11.440 +08:00] [WARN] [pd.go:152] ["get timestamp too slow"] ["cost time"=3m53.447986985s]
[2022/08/30 11:14:11.441 +08:00] [WARN] [pd.go:152] ["get timestamp too slow"] ["cost time"=2m30.428115983s]
[2022/08/30 11:14:11.441 +08:00] [WARN] [pd.go:152] ["get timestamp too slow"] ["cost time"=1m43.129210169s]
[2022/08/30 11:14:11.441 +08:00] [WARN] [pd.go:152] ["get timestamp too slow"] ["cost time"=1m25.330268922s]
[2022/08/30 11:14:11.441 +08:00] [WARN] [pd.go:152] ["get timestamp too slow"] ["cost time"=2m31.406629195s]
[2022/08/30 11:14:11.441 +08:00] [WARN] [pd.go:152] ["get timestamp too slow"] ["cost time"=2.006755488s]
[2022/08/30 11:14:11.441 +08:00] [WARN] [pd.go:152] ["get timestamp too slow"] ["cost time"=1m23.698899791s]
[2022/08/30 11:14:11.441 +08:00] [WARN] [pd.go:152] ["get timestamp too slow"] ["cost time"=3m29.994074807s]
[2022/08/30 11:14:11.441 +08:00] [WARN] [pd.go:152] ["get timestamp too slow"] ["cost time"=2m46.182536793s]
[2022/08/30 11:14:11.441 +08:00] [WARN] [pd.go:152] ["get timestamp too slow"] ["cost time"=2m47.738900119s]
[2022/08/31 21:59:36.828 +08:00] [WARN] [pd.go:152] ["get timestamp too slow"] ["cost time"=32.130223ms]
[2022/08/31 21:59:36.829 +08:00] [WARN] [pd.go:152] ["get timestamp too slow"] ["cost time"=32.737223ms]
[2022/08/31 21:59:36.829 +08:00] [WARN] [pd.go:152] ["get timestamp too slow"] ["cost time"=32.986568ms]
[2022/08/31 23:40:28.458 +08:00] [WARN] [pd.go:152] ["get timestamp too slow"] ["cost time"=55.126072ms]
[2022/08/31 23:40:28.459 +08:00] [WARN] [pd.go:152] ["get timestamp too slow"] ["cost time"=53.593499ms]
[2022/08/31 23:40:28.459 +08:00] [WARN] [pd.go:152] ["get timestamp too slow"] ["cost time"=44.813171ms]
[2022/08/31 23:40:28.459 +08:00] [WARN] [pd.go:152] ["get timestamp too slow"] ["cost time"=54.494222ms]
[2022/08/31 23:40:28.459 +08:00] [WARN] [pd.go:152] ["get timestamp too slow"] ["cost time"=36.673305ms]
[2022/08/31 23:50:01.199 +08:00] [WARN] [pd.go:152] ["get timestamp too slow"] ["cost time"=200.846546ms]
[2022/08/31 23:50:01.200 +08:00] [WARN] [pd.go:152] ["get timestamp too slow"] ["cost time"=201.26946ms]
[2022/08/31 23:50:01.200 +08:00] [WARN] [pd.go:152] ["get timestamp too slow"] ["cost time"=188.38886ms]
[2022/08/31 23:50:01.200 +08:00] [WARN] [pd.go:152] ["get timestamp too slow"] ["cost time"=183.745952ms]
[2022/08/31 23:50:01.200 +08:00] [WARN] [pd.go:152] ["get timestamp too slow"] ["cost time"=170.431684ms]
[2022/08/31 23:50:01.200 +08:00] [WARN] [pd.go:152] ["get timestamp too slow"] ["cost time"=156.86202ms]
[2022/08/31 23:50:01.200 +08:00] [WARN] [pd.go:152] ["get timestamp too slow"] ["cost time"=189.593114ms]
[2022/08/31 23:50:01.200 +08:00] [WARN] [pd.go:152] ["get timestamp too slow"] ["cost time"=182.098671ms]
[2022/09/01 10:15:25.236 +08:00] [WARN] [pd.go:152] ["get timestamp too slow"] ["cost time"=31.404515ms]
[2022/09/01 10:24:13.198 +08:00] [WARN] [pd.go:152] ["get timestamp too slow"] ["cost time"=51.089966ms]
[2022/09/01 11:18:58.224 +08:00] [WARN] [pd.go:152] ["get timestamp too slow"] ["cost time"=280.261084ms]
[2022/09/01 11:18:58.232 +08:00] [WARN] [pd.go:152] ["get timestamp too slow"] ["cost time"=64.238277ms]
[2022/09/01 11:19:13.212 +08:00] [WARN] [pd.go:152] ["get timestamp too slow"] ["cost time"=379.190024ms]
[2022/09/01 11:19:14.240 +08:00] [WARN] [pd.go:152] ["get timestamp too slow"] ["cost time"=1.40279875s]
[2022/09/01 11:19:14.240 +08:00] [WARN] [pd.go:152] ["get timestamp too slow"] ["cost time"=1.17855894s]
{"level":"warn","ts":"2022-09-01T11:19:13.108+0800","logger":"etcd-client","caller":"v3@v3.5.2/retry_interceptor.go:62","msg":"retrying of unary invoker failed","target":"etcd-endpoints://0xc000818e00/xxxxxxxxxxxxx:12379","attempt":0,"error":"rpc error: code = DeadlineExceeded desc = context deadline exceeded"}
[2022/09/01 11:19:14.240 +08:00] [WARN] [pd.go:152] ["get timestamp too slow"] ["cost time"=138.891081ms]
[2022/09/01 11:19:14.240 +08:00] [WARN] [pd.go:152] ["get timestamp too slow"] ["cost time"=883.574894ms]
[2022/09/01 11:19:14.240 +08:00] [WARN] [pd.go:152] ["get timestamp too slow"] ["cost time"=289.149532ms]
[2022/09/01 11:19:14.240 +08:00] [WARN] [pd.go:152] ["get timestamp too slow"] ["cost time"=1.029242222s]
[2022/09/01 11:19:14.240 +08:00] [WARN] [pd.go:152] ["get timestamp too slow"] ["cost time"=1.034388353s]
[2022/09/01 11:19:14.240 +08:00] [WARN] [pd.go:152] ["get timestamp too slow"] ["cost time"=1.016232402s]
2022/09/01 11:19:14.238554 juicefs[176388] <INFO>: slow operation: read (19520231,131072,49152): OK (131072) <20.076499> [accesslog.go:65]
[2022/09/01 11:19:14.242 +08:00] [ERROR] [kv.go:243] ["fail to load safepoint from pd"] [error="context deadline exceeded"] [errorVerbose="context deadline exceeded\ngithub.com/tikv/client-go/v2/tikv.(*EtcdSafePointKV).Get\n\t/go/pkg/mod/github.com/tikv/client-go/v2@v2.0.1/tikv/safepoint.go:148\ngithub.com/tikv/client-go/v2/tikv.loadSafePoint\n\t/go/pkg/mod/github.com/tikv/client-go/v2@v2.0.1/tikv/safepoint.go:183\ngithub.com/tikv/client-go/v2/tikv.(*KVStore).runSafePointChecker\n\t/go/pkg/mod/github.com/tikv/client-go/v2@v2.0.1/tikv/kv.go:236\nruntime.goexit\n\t/usr/local/go/src/runtime/asm_amd64.s:1581"] [stack="github.com/tikv/client-go/v2/tikv.(*KVStore).runSafePointChecker\n\t/go/pkg/mod/github.com/tikv/client-go/v2@v2.0.1/tikv/kv.go:243"]
2022/09/01 11:19:14.244412 juicefs[176388] <INFO>: slow operation: read (19520231,4096,12288): OK (4096) <20.465092> [accesslog.go:65]
[2022/09/01 11:19:14.250 +08:00] [WARN] [client_batch.go:365] ["no available connections"] [target=xxxxxxxxxxxxx:20160]
[2022/09/01 11:19:14.250 +08:00] [WARN] [client_batch.go:365] ["no available connections"] [target=xxxxxxxxxxxxx:20160]
2022/09/01 11:19:14.429547 juicefs[176388] <INFO>: slow operation: getattr (19520271): OK (19520271,[-rw-r--r--:0100644,1,1149,1154,1661956465,1661956466,1661956466,8902481]) <23.256601> [accesslog.go:65]
2022/09/01 11:19:14.630981 juicefs[176388] <INFO>: slow operation: getattr (19520231): OK (19520231,[-rw-r--r--:0100644,1,1149,1154,1661956458,1661956458,1661956458,8736621]) <22.196798> [accesslog.go:65]
[2022/09/01 14:25:48.949 +08:00] [WARN] [pd.go:152] ["get timestamp too slow"] ["cost time"=32.311065ms]
[2022/09/01 14:32:42.064 +08:00] [WARN] [pd.go:152] ["get timestamp too slow"] ["cost time"=35.361897ms]
[2022/09/02 06:48:32.228 +08:00] [WARN] [pd.go:152] ["get timestamp too slow"] ["cost time"=30.843129ms]
[2022/09/02 06:48:32.474 +08:00] [WARN] [pd.go:152] ["get timestamp too slow"] ["cost time"=64.49373ms]
[2022/09/02 06:48:33.220 +08:00] [WARN] [pd.go:152] ["get timestamp too slow"] ["cost time"=62.966888ms]
[2022/09/02 06:48:33.220 +08:00] [WARN] [pd.go:152] ["get timestamp too slow"] ["cost time"=62.818289ms]
[2022/09/02 06:48:33.220 +08:00] [WARN] [pd.go:152] ["get timestamp too slow"] ["cost time"=62.354653ms]
[2022/09/02 06:48:33.220 +08:00] [WARN] [pd.go:152] ["get timestamp too slow"] ["cost time"=36.602162ms]
[2022/09/02 06:48:33.782 +08:00] [WARN] [pd.go:152] ["get timestamp too slow"] ["cost time"=223.880512ms]
[2022/09/02 06:48:33.783 +08:00] [WARN] [pd.go:152] ["get timestamp too slow"] ["cost time"=176.864619ms]
[2022/09/02 06:48:33.783 +08:00] [WARN] [pd.go:152] ["get timestamp too slow"] ["cost time"=200.138705ms]
[2022/09/02 06:48:35.104 +08:00] [WARN] [pd.go:152] ["get timestamp too slow"] ["cost time"=112.622043ms]
[2022/09/02 06:48:35.104 +08:00] [WARN] [pd.go:152] ["get timestamp too slow"] ["cost time"=110.634497ms]
[2022/09/02 06:48:35.104 +08:00] [WARN] [pd.go:152] ["get timestamp too slow"] ["cost time"=70.519419ms]
[2022/09/02 06:48:35.104 +08:00] [WARN] [pd.go:152] ["get timestamp too slow"] ["cost time"=69.131681ms]
[2022/09/02 06:48:35.104 +08:00] [WARN] [pd.go:152] ["get timestamp too slow"] ["cost time"=77.217688ms]
[2022/09/02 06:48:35.264 +08:00] [WARN] [pd.go:152] ["get timestamp too slow"] ["cost time"=156.425661ms]
[2022/09/02 06:48:35.264 +08:00] [WARN] [pd.go:152] ["get timestamp too slow"] ["cost time"=156.556584ms]
[2022/09/02 06:48:35.265 +08:00] [WARN] [pd.go:152] ["get timestamp too slow"] ["cost time"=147.484493ms]
[2022/09/02 06:48:35.265 +08:00] [WARN] [pd.go:152] ["get timestamp too slow"] ["cost time"=155.815207ms]
[2022/09/02 06:48:35.265 +08:00] [WARN] [pd.go:152] ["get timestamp too slow"] ["cost time"=155.444237ms]
[2022/09/02 12:40:22.926 +08:00] [WARN] [pd.go:152] ["get timestamp too slow"] ["cost time"=200.520365ms]
[2022/09/02 12:40:22.926 +08:00] [WARN] [pd.go:152] ["get timestamp too slow"] ["cost time"=200.360285ms]
[2022/09/02 12:40:22.926 +08:00] [WARN] [pd.go:152] ["get timestamp too slow"] ["cost time"=180.317494ms]
[2022/09/02 12:40:22.926 +08:00] [WARN] [pd.go:152] ["get timestamp too slow"] ["cost time"=131.156883ms]
2022/09/04 19:07:04.777665 juicefs[176388] <INFO>: cleanup trash: deleted 32104 files in 4m58.535234386s [base.go:1053]
[2022/09/05 12:16:29.941 +08:00] [WARN] [pd.go:152] ["get timestamp too slow"] ["cost time"=99.276106ms]
[2022/09/05 13:03:07.535 +08:00] [WARN] [pd.go:152] ["get timestamp too slow"] ["cost time"=33.510068ms]
[2022/09/05 14:11:15.483 +08:00] [WARN] [pd.go:152] ["get timestamp too slow"] ["cost time"=53.135573ms]
[2022/09/05 14:28:00.047 +08:00] [WARN] [pd.go:152] ["get timestamp too slow"] ["cost time"=78.989441ms]
[2022/09/05 15:09:34.894 +08:00] [WARN] [pd.go:152] ["get timestamp too slow"] ["cost time"=58.312619ms]
[2022/09/05 15:51:44.631 +08:00] [WARN] [pd.go:152] ["get timestamp too slow"] ["cost time"=62.793859ms]
[2022/09/05 16:51:20.774 +08:00] [WARN] [pd.go:152] ["get timestamp too slow"] ["cost time"=51.169308ms]
[2022/09/05 16:51:20.688 +08:00] [WARN] [pd.go:152] ["get timestamp too slow"] ["cost time"=53.750059ms]
[2022/09/05 19:57:25.196 +08:00] [WARN] [pd.go:152] ["get timestamp too slow"] ["cost time"=59.172118ms]
[2022/09/05 22:54:03.682 +08:00] [WARN] [pd.go:152] ["get timestamp too slow"] ["cost time"=57.562685ms]
[2022/09/07 16:04:56.737 +08:00] [WARN] [pd.go:152] ["get timestamp too slow"] ["cost time"=41.234256ms]
[2022/09/07 18:25:19.533 +08:00] [WARN] [pd.go:152] ["get timestamp too slow"] ["cost time"=46.313173ms]
[2022/09/07 19:58:23.914 +08:00] [WARN] [client_batch.go:794] ["wait response is cancelled"] [to=xxxxxxxxxxxxx:20160] [cause="context canceled"]
[2022/09/07 19:58:24.527 +08:00] [WARN] [client_batch.go:794] ["wait response is cancelled"] [to=xxxxxxxxxxxxx:20160] [cause="context canceled"]
2022/09/07 19:58:24.632653 juicefs[176388] <WARNING>: Transaction succeeded after 3 tries (98.258901ms), inodes: [41013107], error: write conflict { start_ts:435828006484181007 conflict_ts:435828006484181003 key:"file-meta\375As\317q\002\000\000\000\000C\000\000\000\000" primary:"file-meta\375As\317q\002\000\000\000\000C\000\000\000\000" conflict_commit_ts:435828006484181012 } [tkv.go:651]
[2022/09/07 19:58:59.193 +08:00] [WARN] [client_batch.go:794] ["wait response is cancelled"] [to=xxxxxxxxxxxxx:20160] [cause="context canceled"]
[2022/09/07 20:02:03.805 +08:00] [WARN] [client_batch.go:794] ["wait response is cancelled"] [to=xxxxxxxxxxxxx:20160] [cause="context canceled"]
[2022/09/07 20:02:04.716 +08:00] [WARN] [client_batch.go:794] ["wait response is cancelled"] [toxxxxxxxxxxxxx:20160] [cause="context canceled"]
[2022/09/07 20:02:06.175 +08:00] [WARN] [client_batch.go:794] ["wait response is cancelled"] [to=xxxxxxxxxxxxx:20160] [cause="context canceled"]
[2022/09/07 20:02:06.852 +08:00] [WARN] [client_batch.go:794] ["wait response is cancelled"] [to=xxxxxxxxxxxxx:20160] [cause="context canceled"]
[2022/09/07 20:02:21.367 +08:00] [WARN] [client_batch.go:794] ["wait response is cancelled"] [to=xxxxxxxxxxxxx:20160] [cause="context canceled"]
[2022/09/07 20:02:21.675 +08:00] [WARN] [client_batch.go:794] ["wait response is cancelled"] [to=xxxxxxxxxxxxx:20160] [cause="context canceled"]
[2022/09/07 20:02:25.553 +08:00] [WARN] [client_batch.go:794] ["wait response is cancelled"] [to=xxxxxxxxxxxxx:20160] [cause="context canceled"]
[2022/09/07 20:02:28.262 +08:00] [WARN] [client_batch.go:794] ["wait response is cancelled"] [to=xxxxxxxxxxxxx:20160] [cause="context canceled"]
[2022/09/07 20:02:28.367 +08:00] [WARN] [client_batch.go:794] ["wait response is cancelled"] [to=xxxxxxxxxxxxx:20160] [cause="context canceled"]
[2022/09/07 20:02:29.744 +08:00] [WARN] [client_batch.go:794] ["wait response is cancelled"] [to=xxxxxxxxxxxxx:20160] [cause="context canceled"]
[2022/09/07 20:02:31.513 +08:00] [WARN] [client_batch.go:794] ["wait response is cancelled"] [to=xxxxxxxxxxxxx:20160] [cause="context canceled"]
[2022/09/07 20:02:31.873 +08:00] [WARN] [client_batch.go:794] ["wait response is cancelled"] [to=xxxxxxxxxxxxx:20160] [cause="context canceled"]
[2022/09/07 20:02:32.098 +08:00] [WARN] [client_batch.go:794] ["wait response is cancelled"] [to=xxxxxxxxxxxxx:20160] [cause="context canceled"]
[2022/09/07 20:02:33.777 +08:00] [WARN] [client_batch.go:794] ["wait response is cancelled"] [to=xxxxxxxxxxxxx:20160] [cause="context canceled"]
[2022/09/07 20:55:11.781 +08:00] [WARN] [client_batch.go:794] ["wait response is cancelled"] [to=xxxxxxxxxxxxx:20160] [cause="context canceled"]
[2022/09/08 08:57:09.643 +08:00] [WARN] [pd.go:152] ["get timestamp too slow"] ["cost time"=30.254101ms]
[2022/09/09 15:04:25.698 +08:00] [WARN] [pd.go:152] ["get timestamp too slow"] ["cost time"=211.449067ms]
[2022/09/10 12:10:14.728 +08:00] [WARN] [pd.go:152] ["get timestamp too slow"] ["cost time"=35.909212ms]
[2022/09/12 05:05:57.519 +08:00] [WARN] [pd.go:152] ["get timestamp too slow"] ["cost time"=32.745798ms]
[2022/09/12 17:22:51.264 +08:00] [WARN] [pd.go:152] ["get timestamp too slow"] ["cost time"=30.70716ms]
[2022/09/12 17:58:44.724 +08:00] [WARN] [pd.go:152] ["get timestamp too slow"] ["cost time"=30.005744ms] |
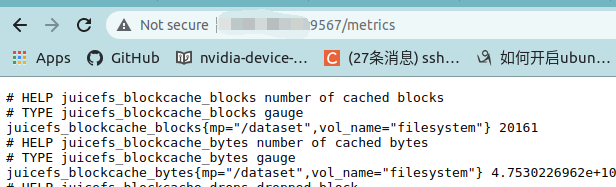
Beta Was this translation helpful? Give feedback.
-
|
Since the Juicefs has registered successfully to consul, the problem should not be here in Juicefs. |
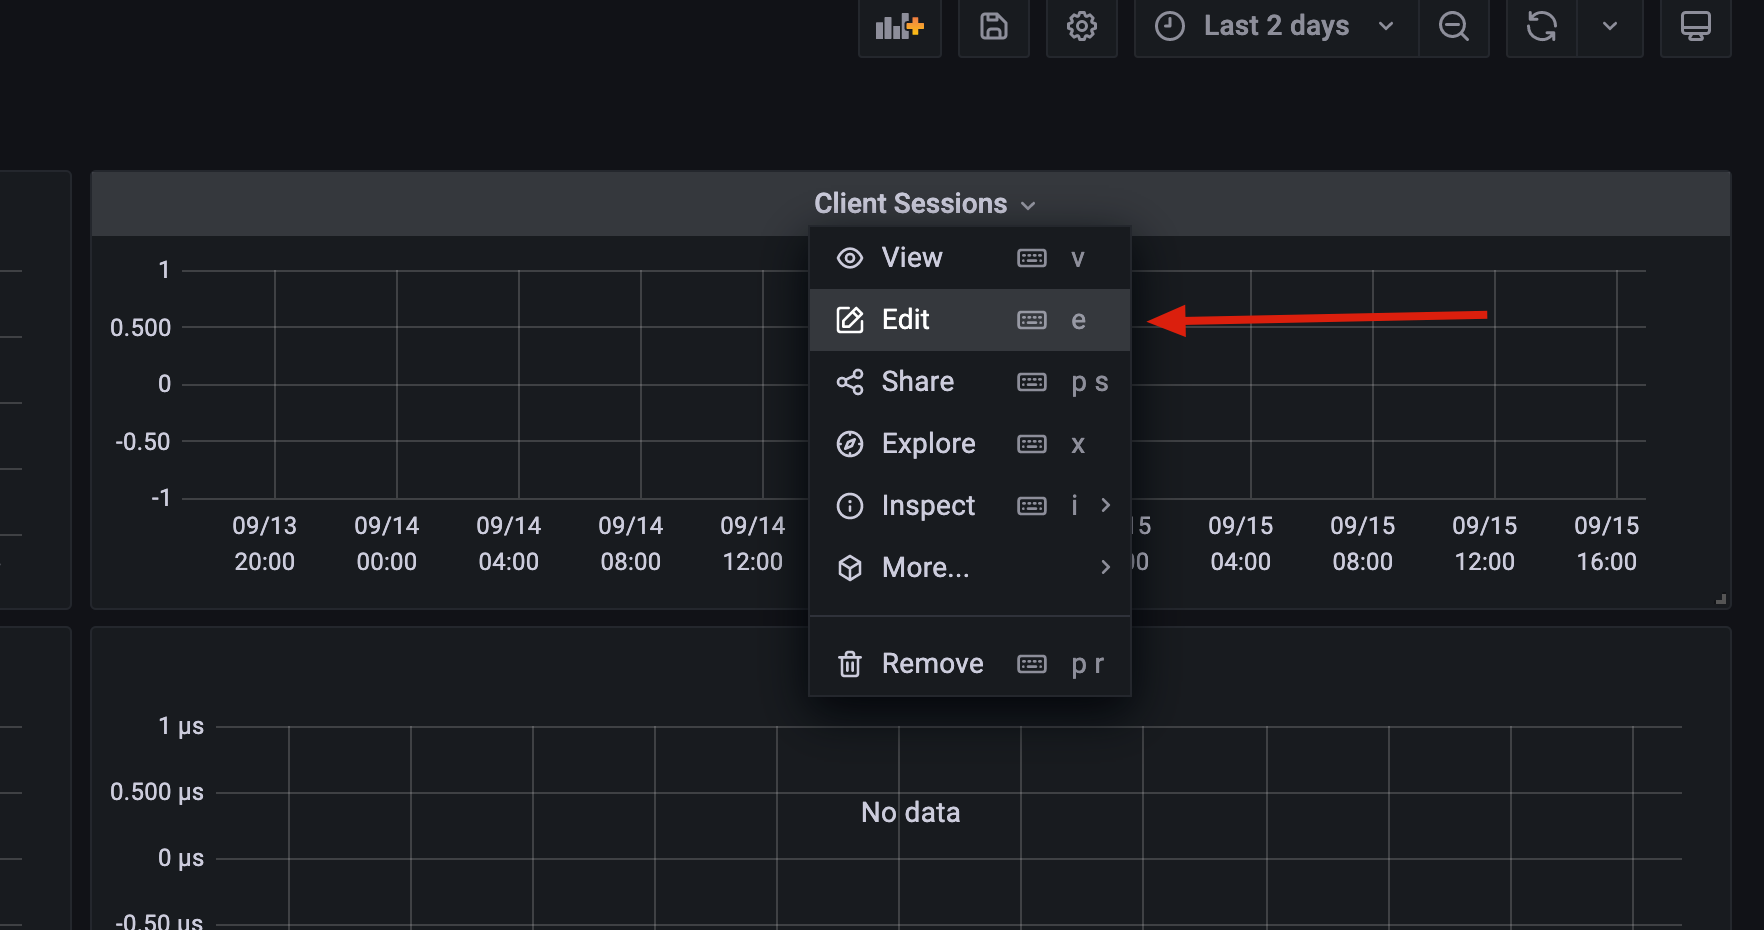
Beta Was this translation helpful? Give feedback.
-
|
It shows that we cannot get metrics of node40 in prometheus:
|
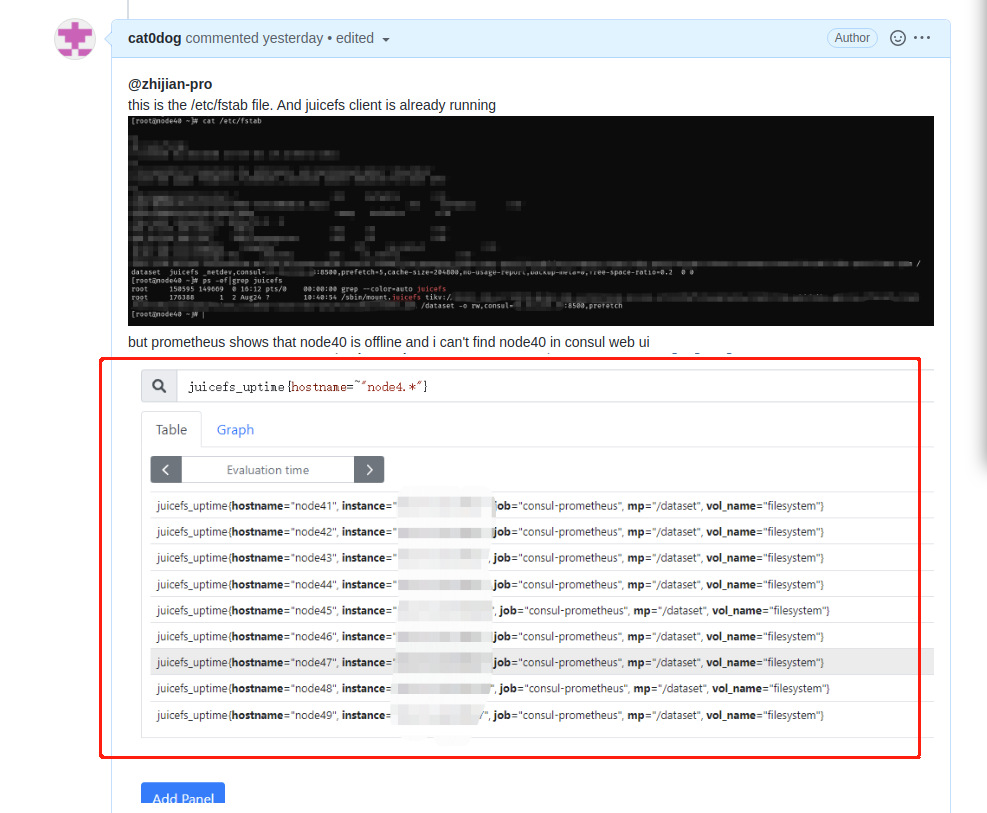
Beta Was this translation helpful? Give feedback.
-
|
And i cannot find node40 in consul web ui |
Beta Was this translation helpful? Give feedback.
-
|
Can you send your WeChat account to my email : jiaxingduan@gmail.com ? I can help you isolate it. |
Beta Was this translation helpful? Give feedback.
Uh oh!
There was an error while loading. Please reload this page.
-
What happened:
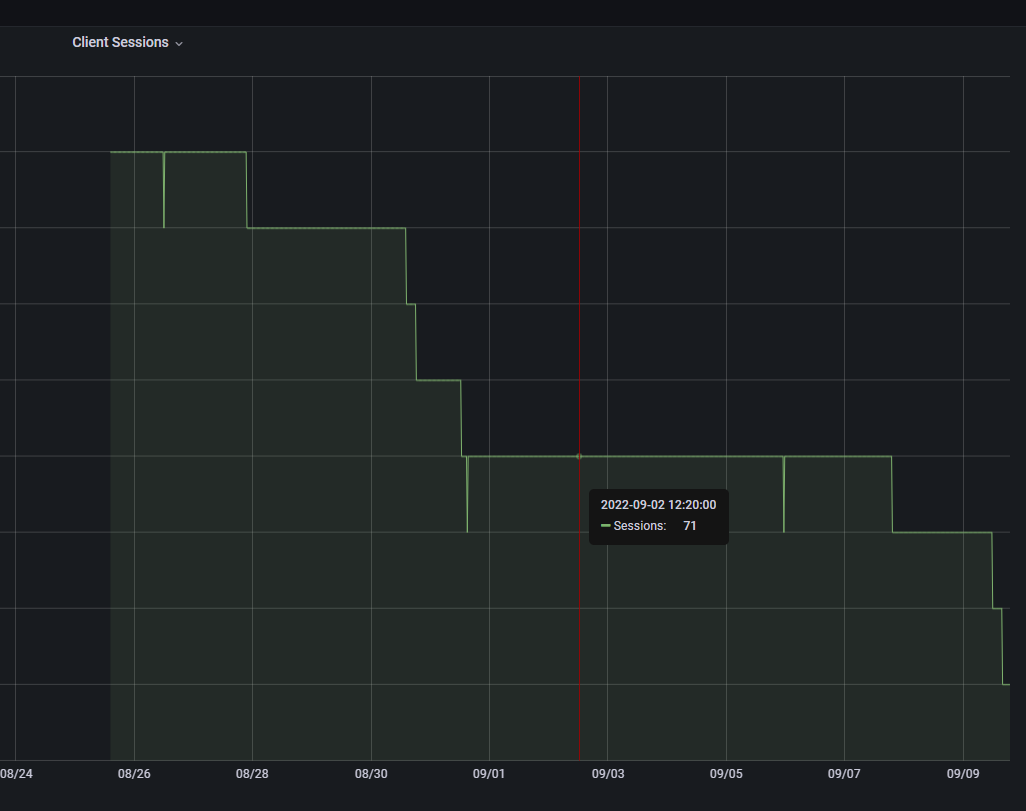
juicefs client monitoring does not automatically reply after a drop
How to reproduce it (as minimally and precisely as possible):
Nodes with juicefs client resume normal operation after an OOM
Anything else we need to know?
Our juicefs client uses consul for service discovery
Environment:
juicefs --version) or Hadoop Java SDK version:root@node75:~/juicefs-u# ./juicefs --version juicefs version 1.0.0+2022-08-08.cf0c269cat /etc/os-release):jfs client nodes information that cannot be recovered after a drop
Beta Was this translation helpful? Give feedback.
All reactions