In-app debug tools for Flutter UI, rendering, logs, navigation, and device diagnostics - no context switching required.

Features • Installation • Quick Start • Debug Logs • Tips • License
| Screenshots | ||
|---|---|---|
 |
 |
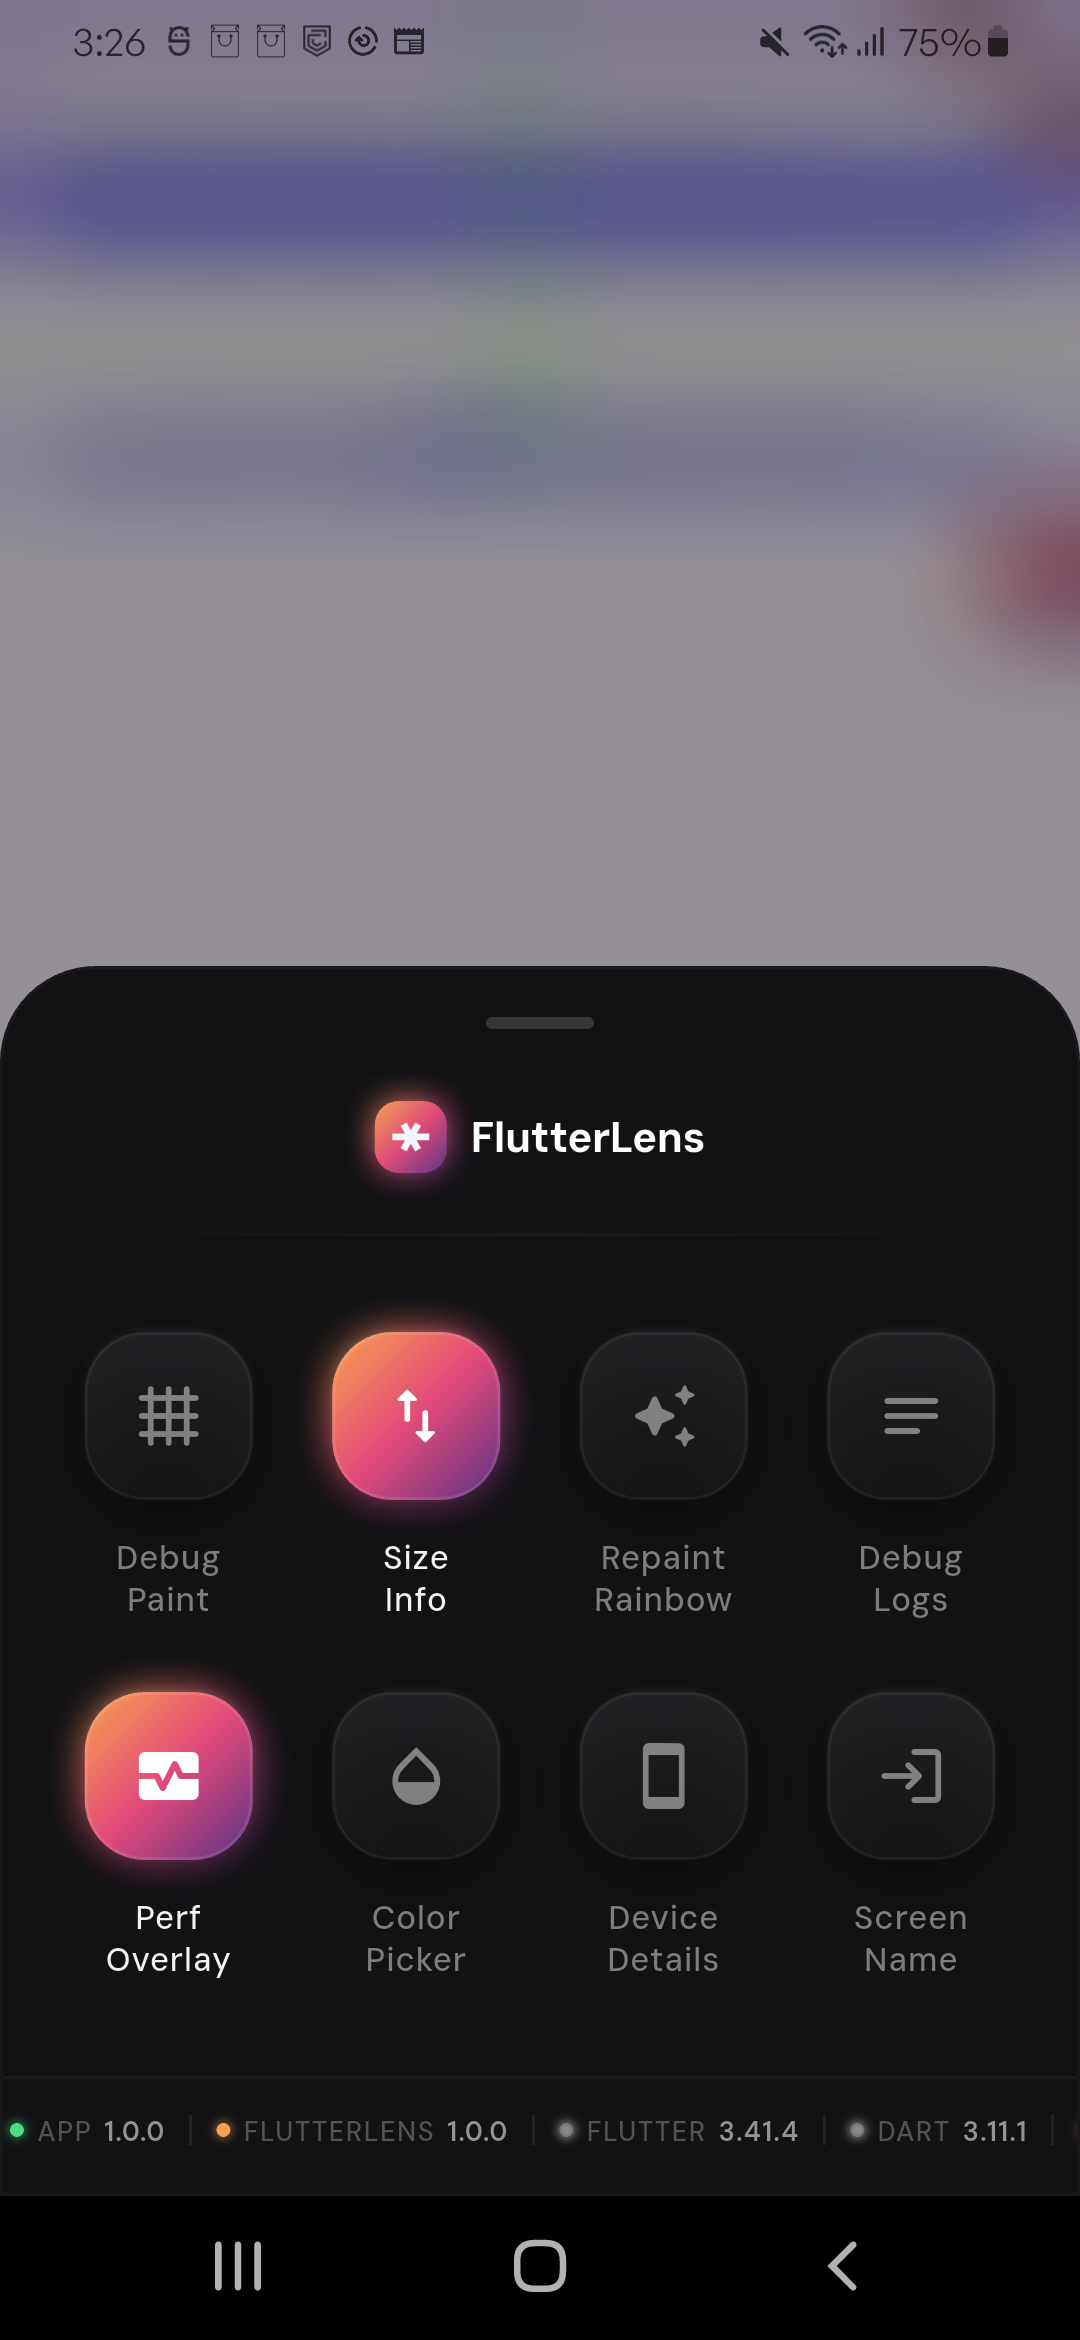 |
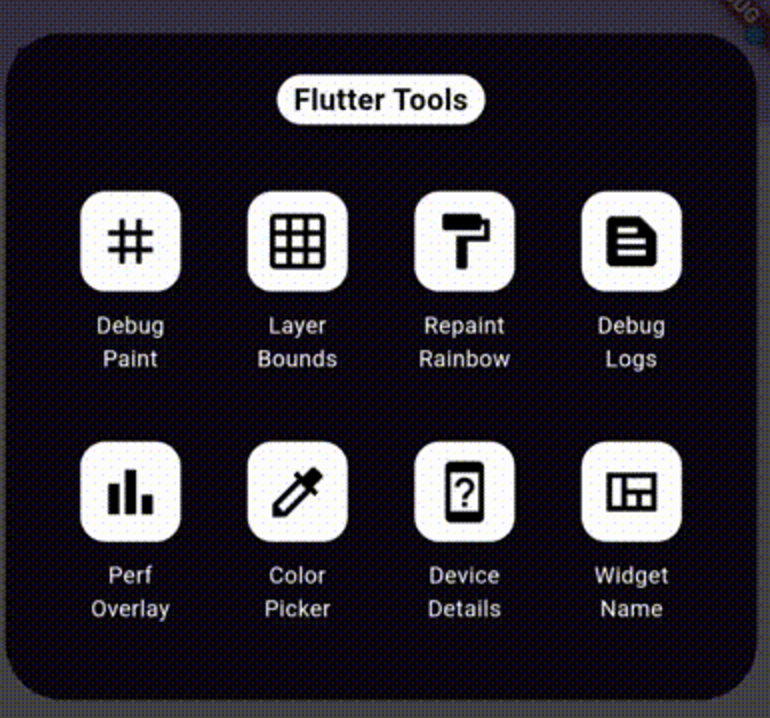
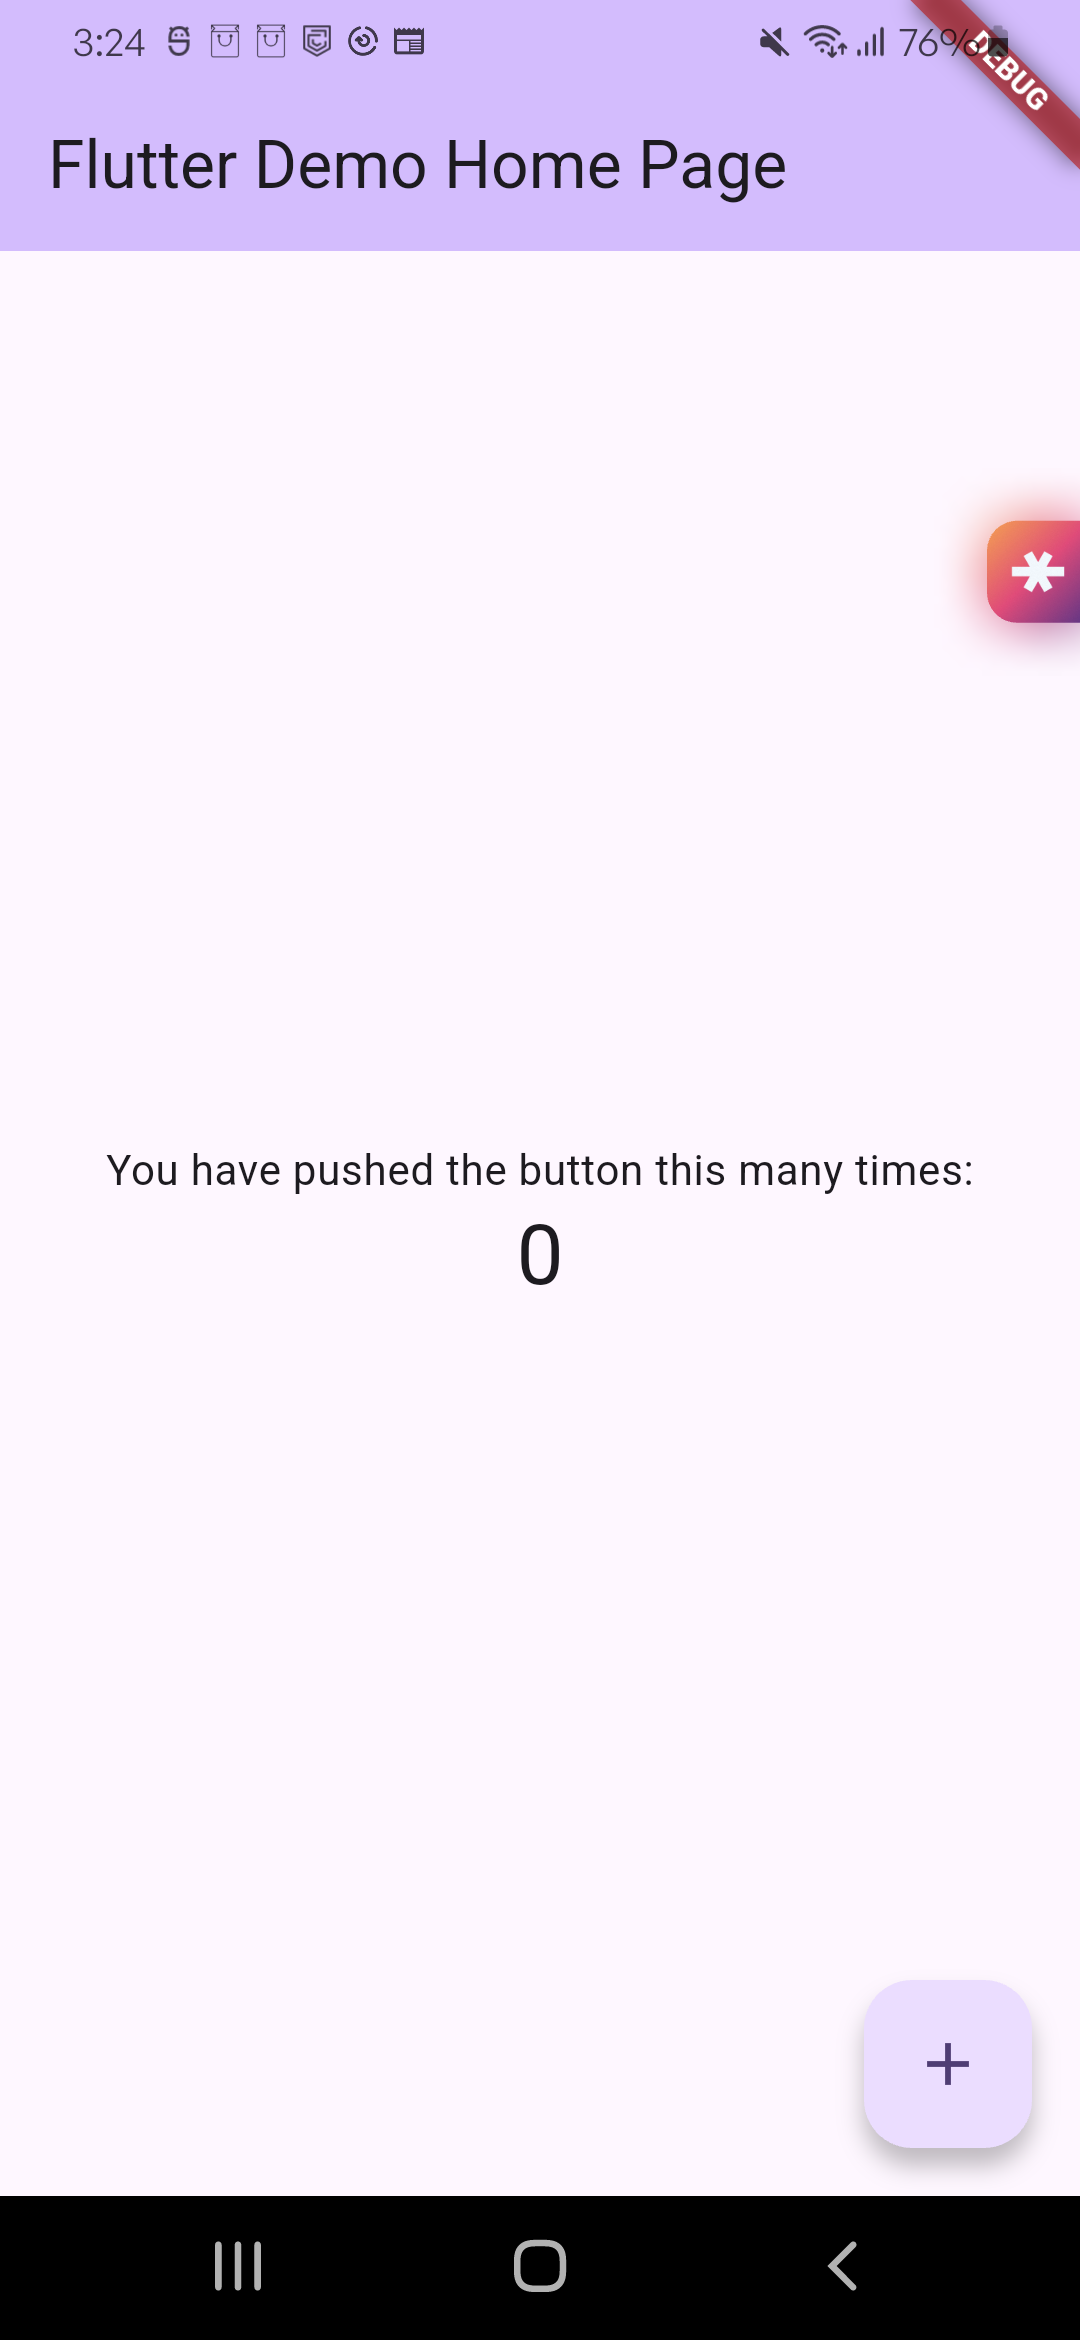
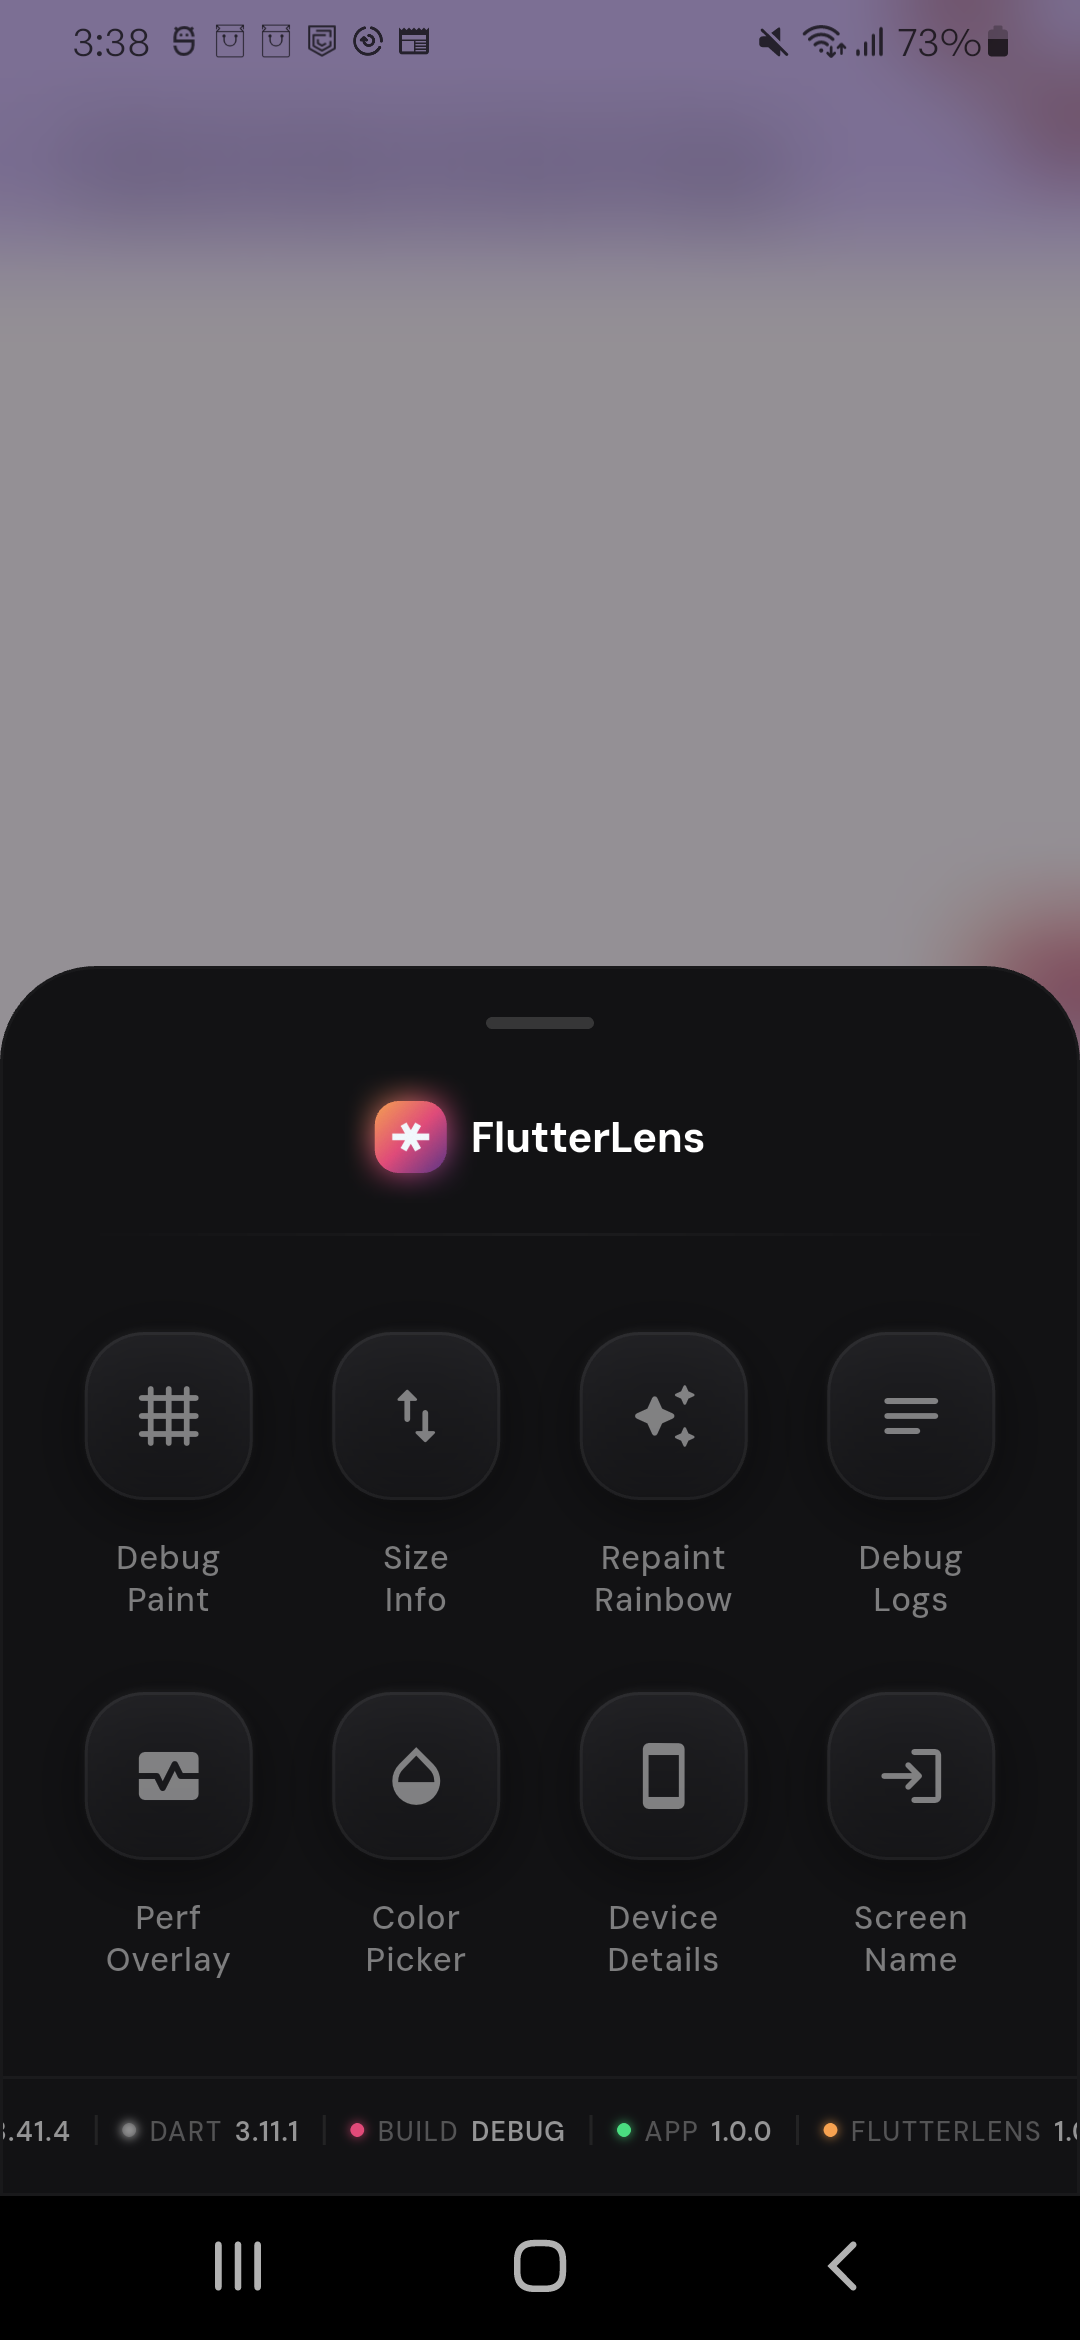
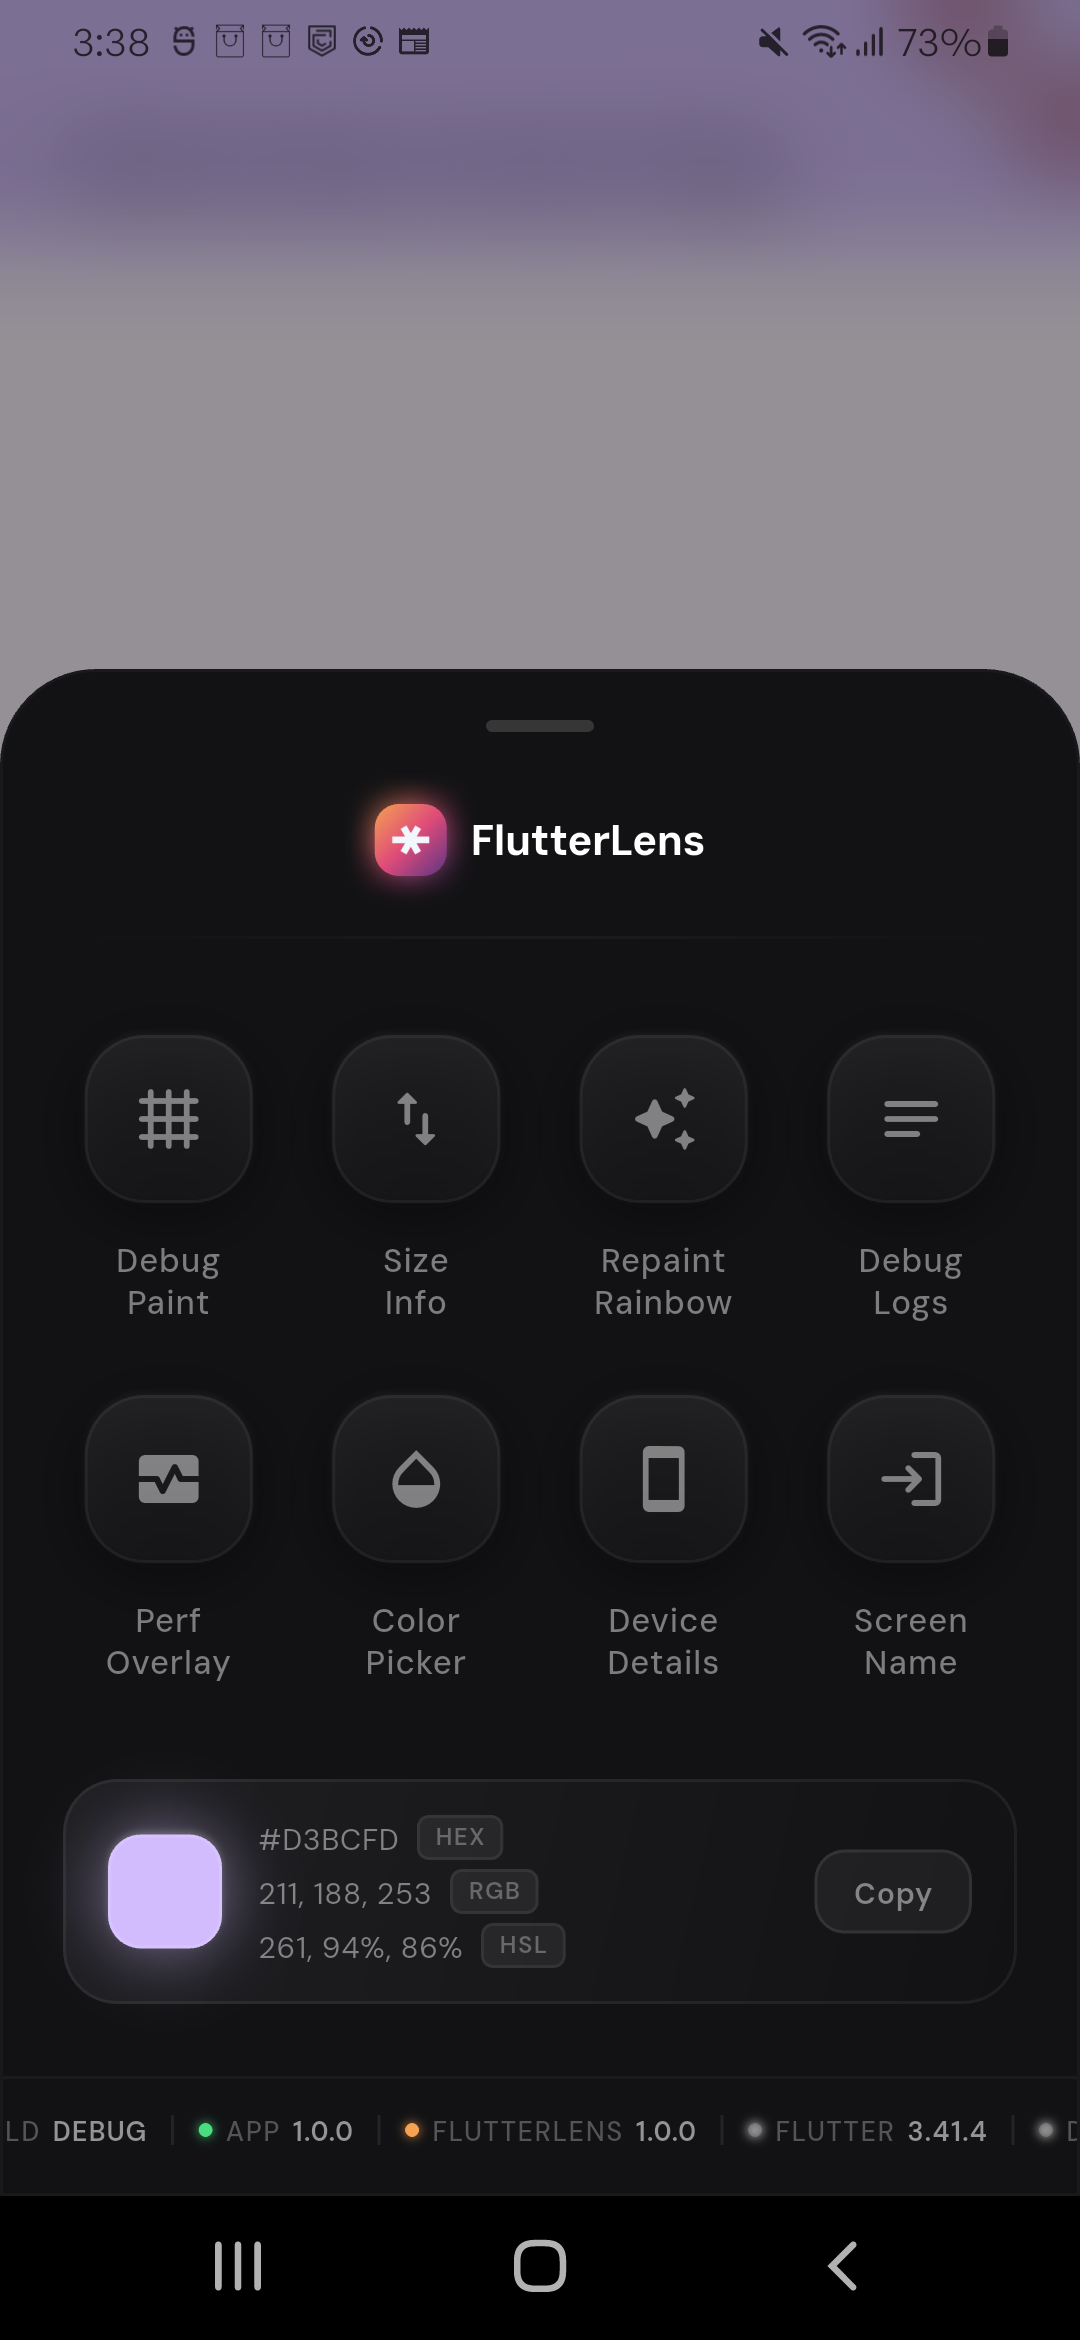
| 🧲 Edge tray launcher docked to the right side; draggable and always accessible. | 🧾 Version ticker displaying app, FlutterLens, Flutter, Dart, and build mode details. | 📋 Bottom sheet tools grid with active/inactive visual states and quick toggles. |
 |
 |
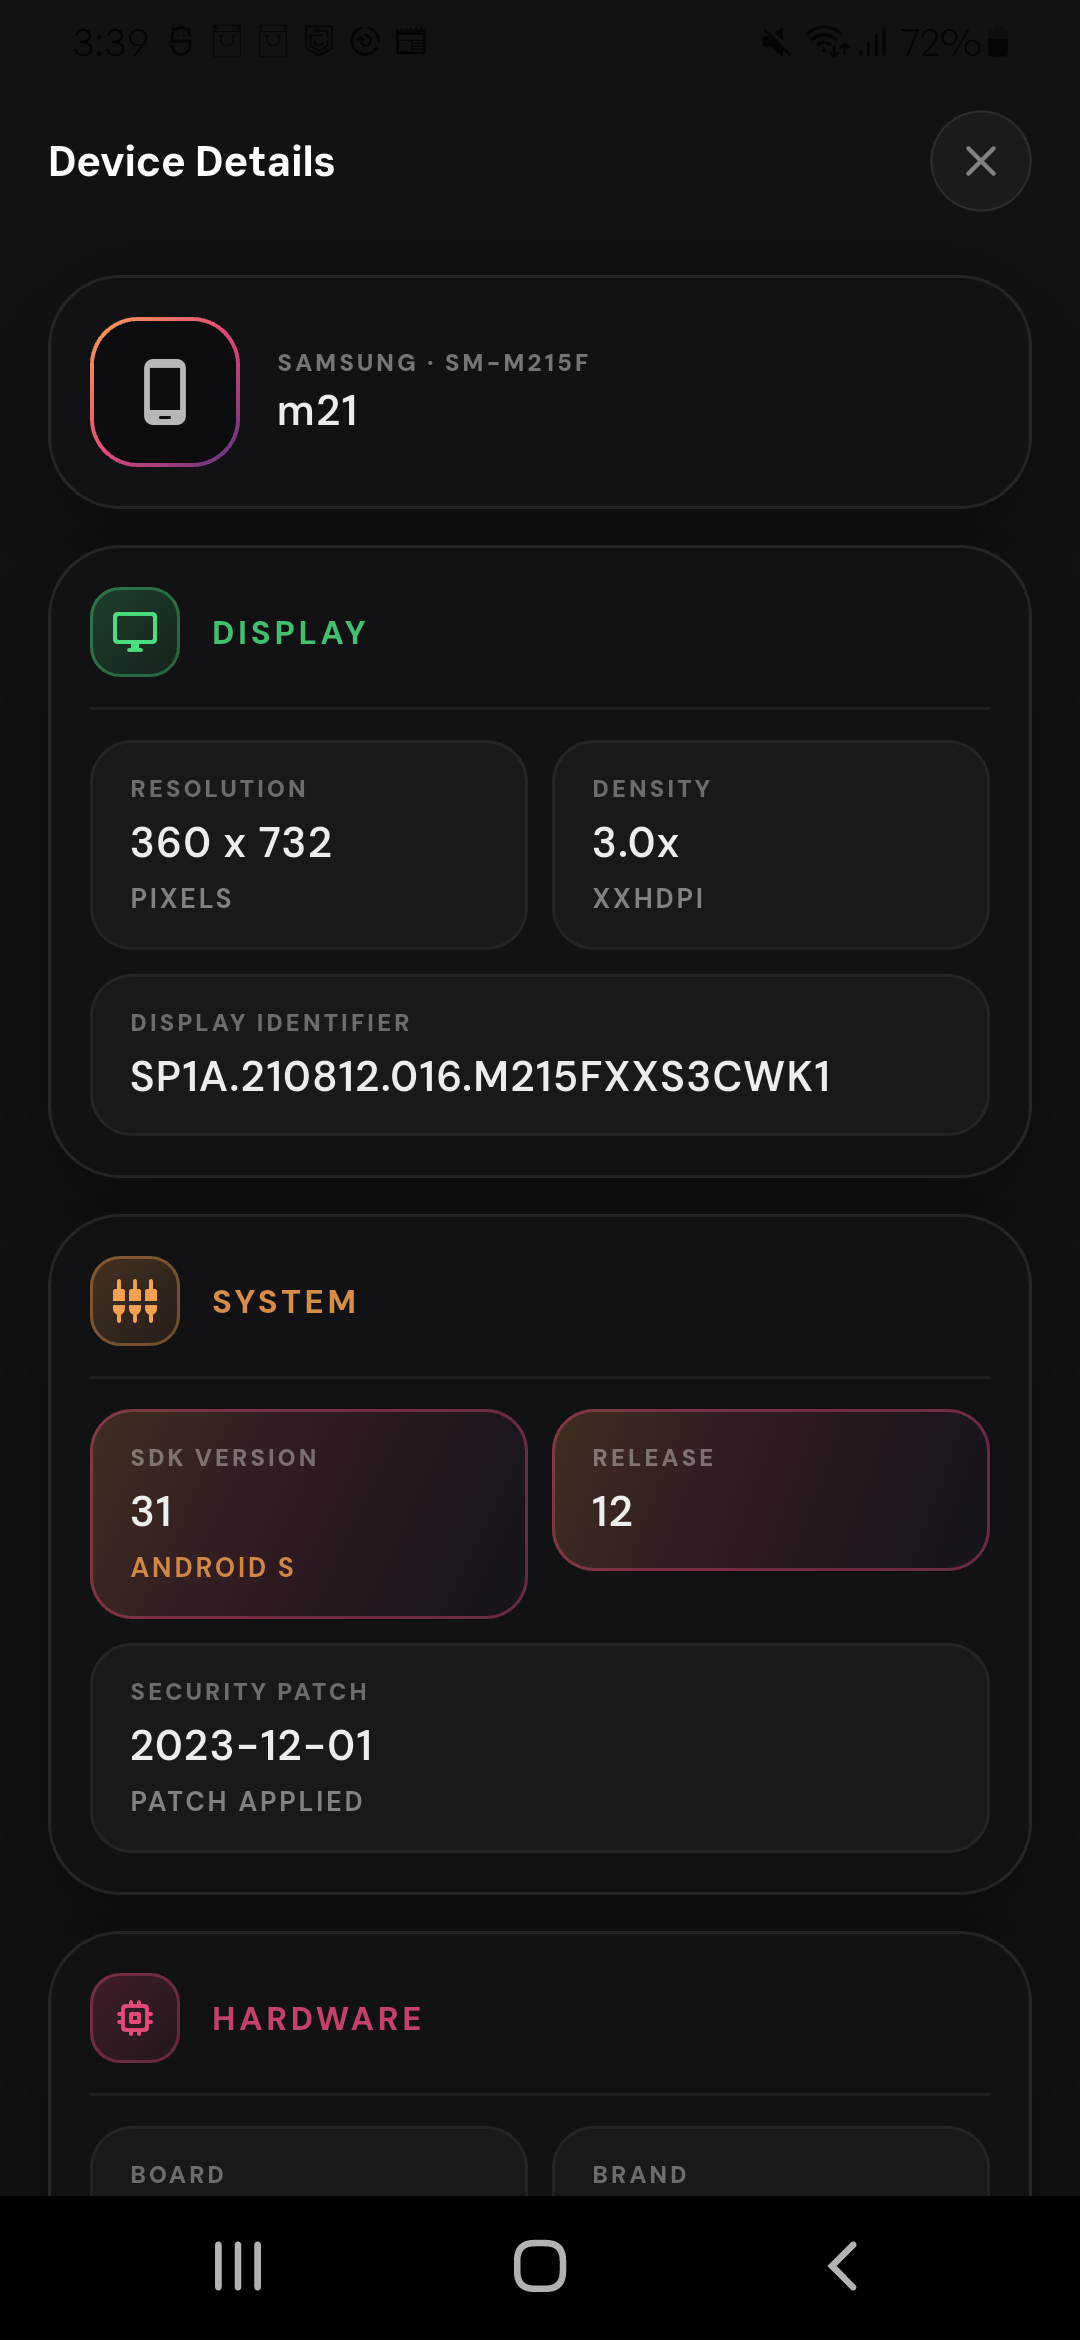 |
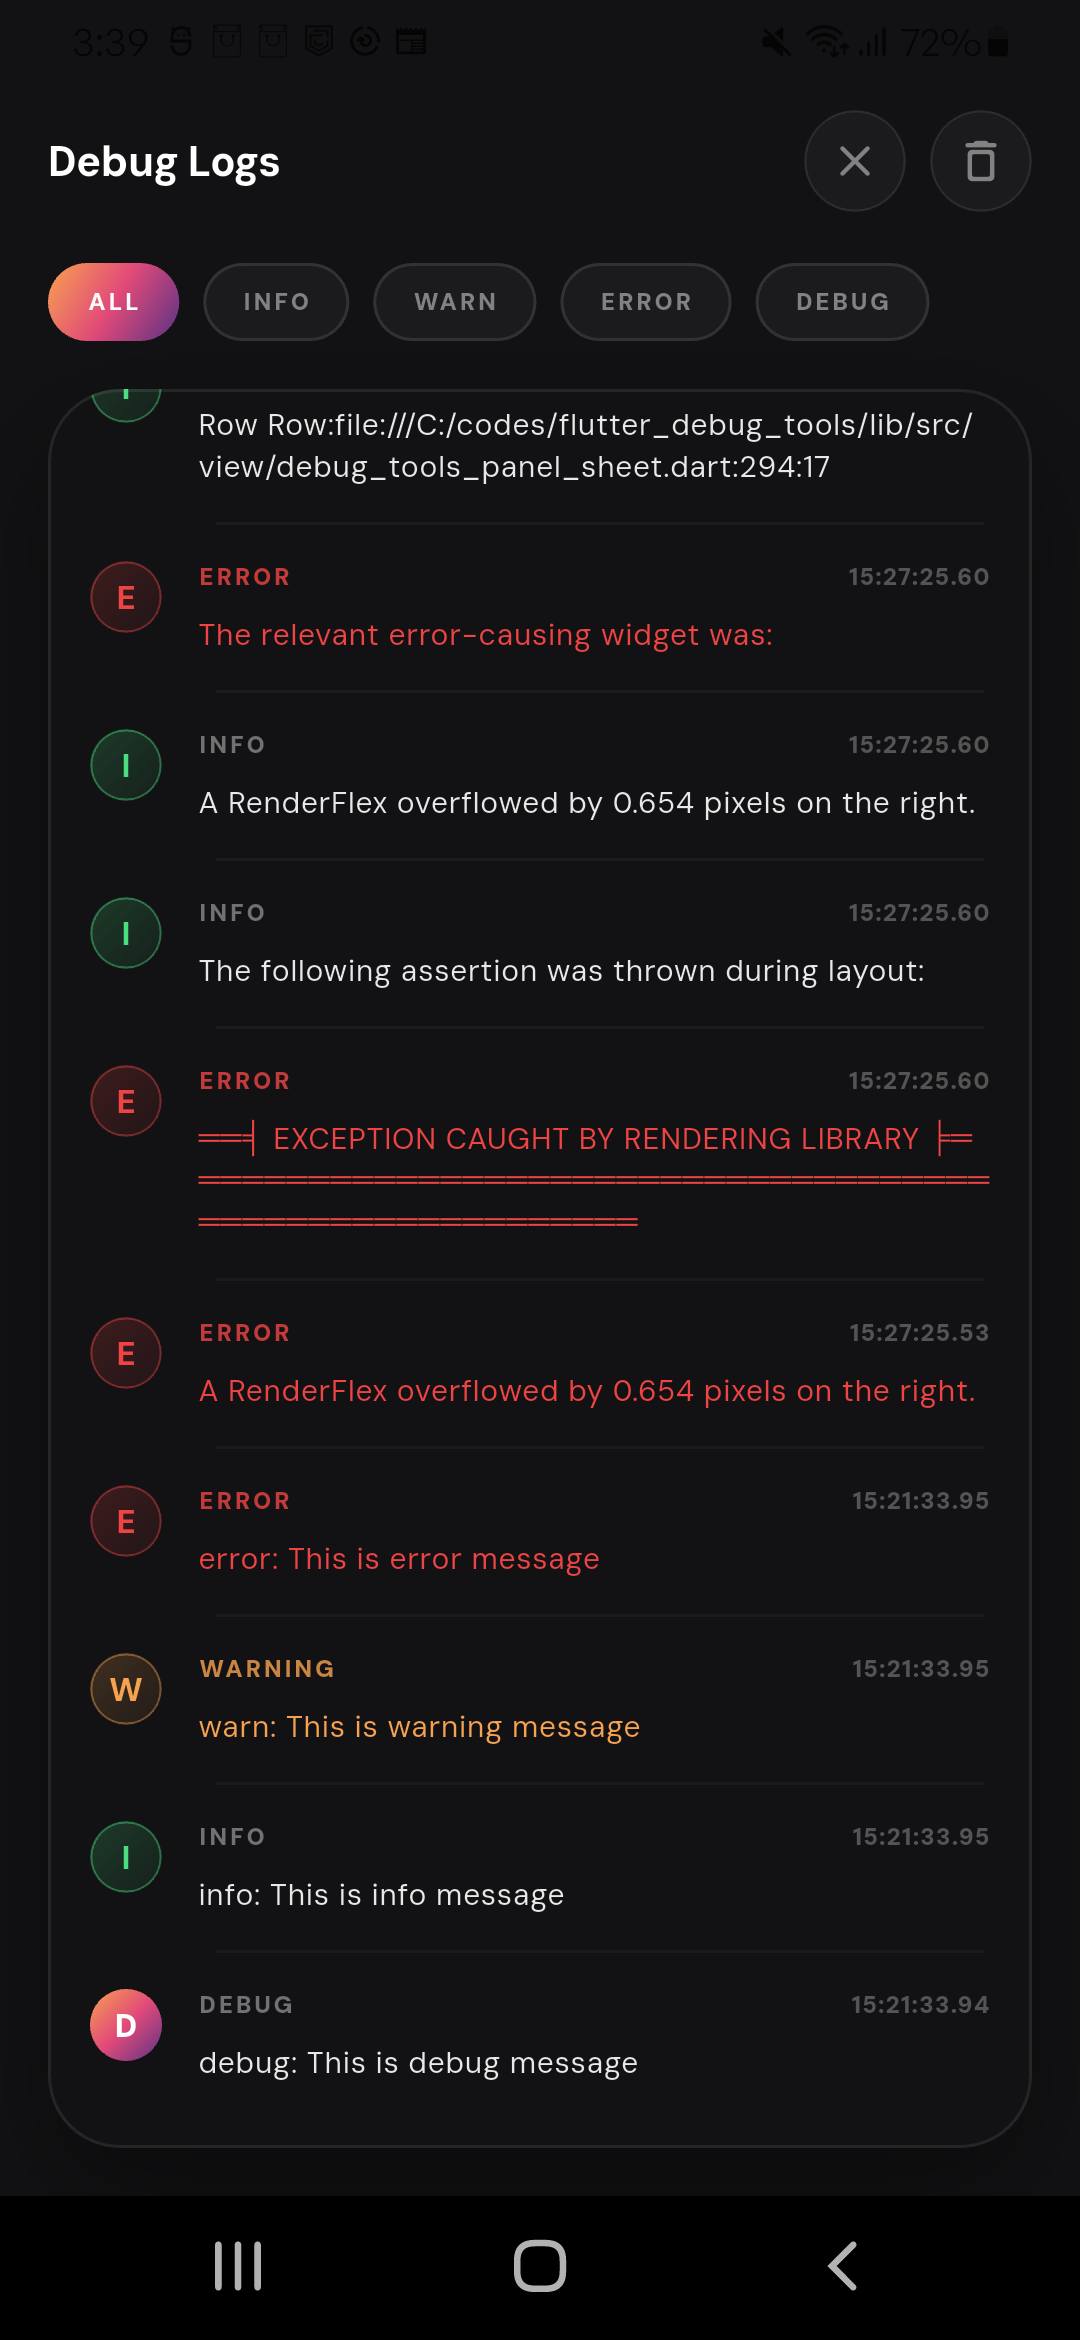
| 📱 In-app debug logs to inspect console logs inside the running app. | 🎨 Color result card showing selected color in HEX, RGB, and HSL with copy action. | ⚡ Device details to quickly check and share device details. |
 |
 |
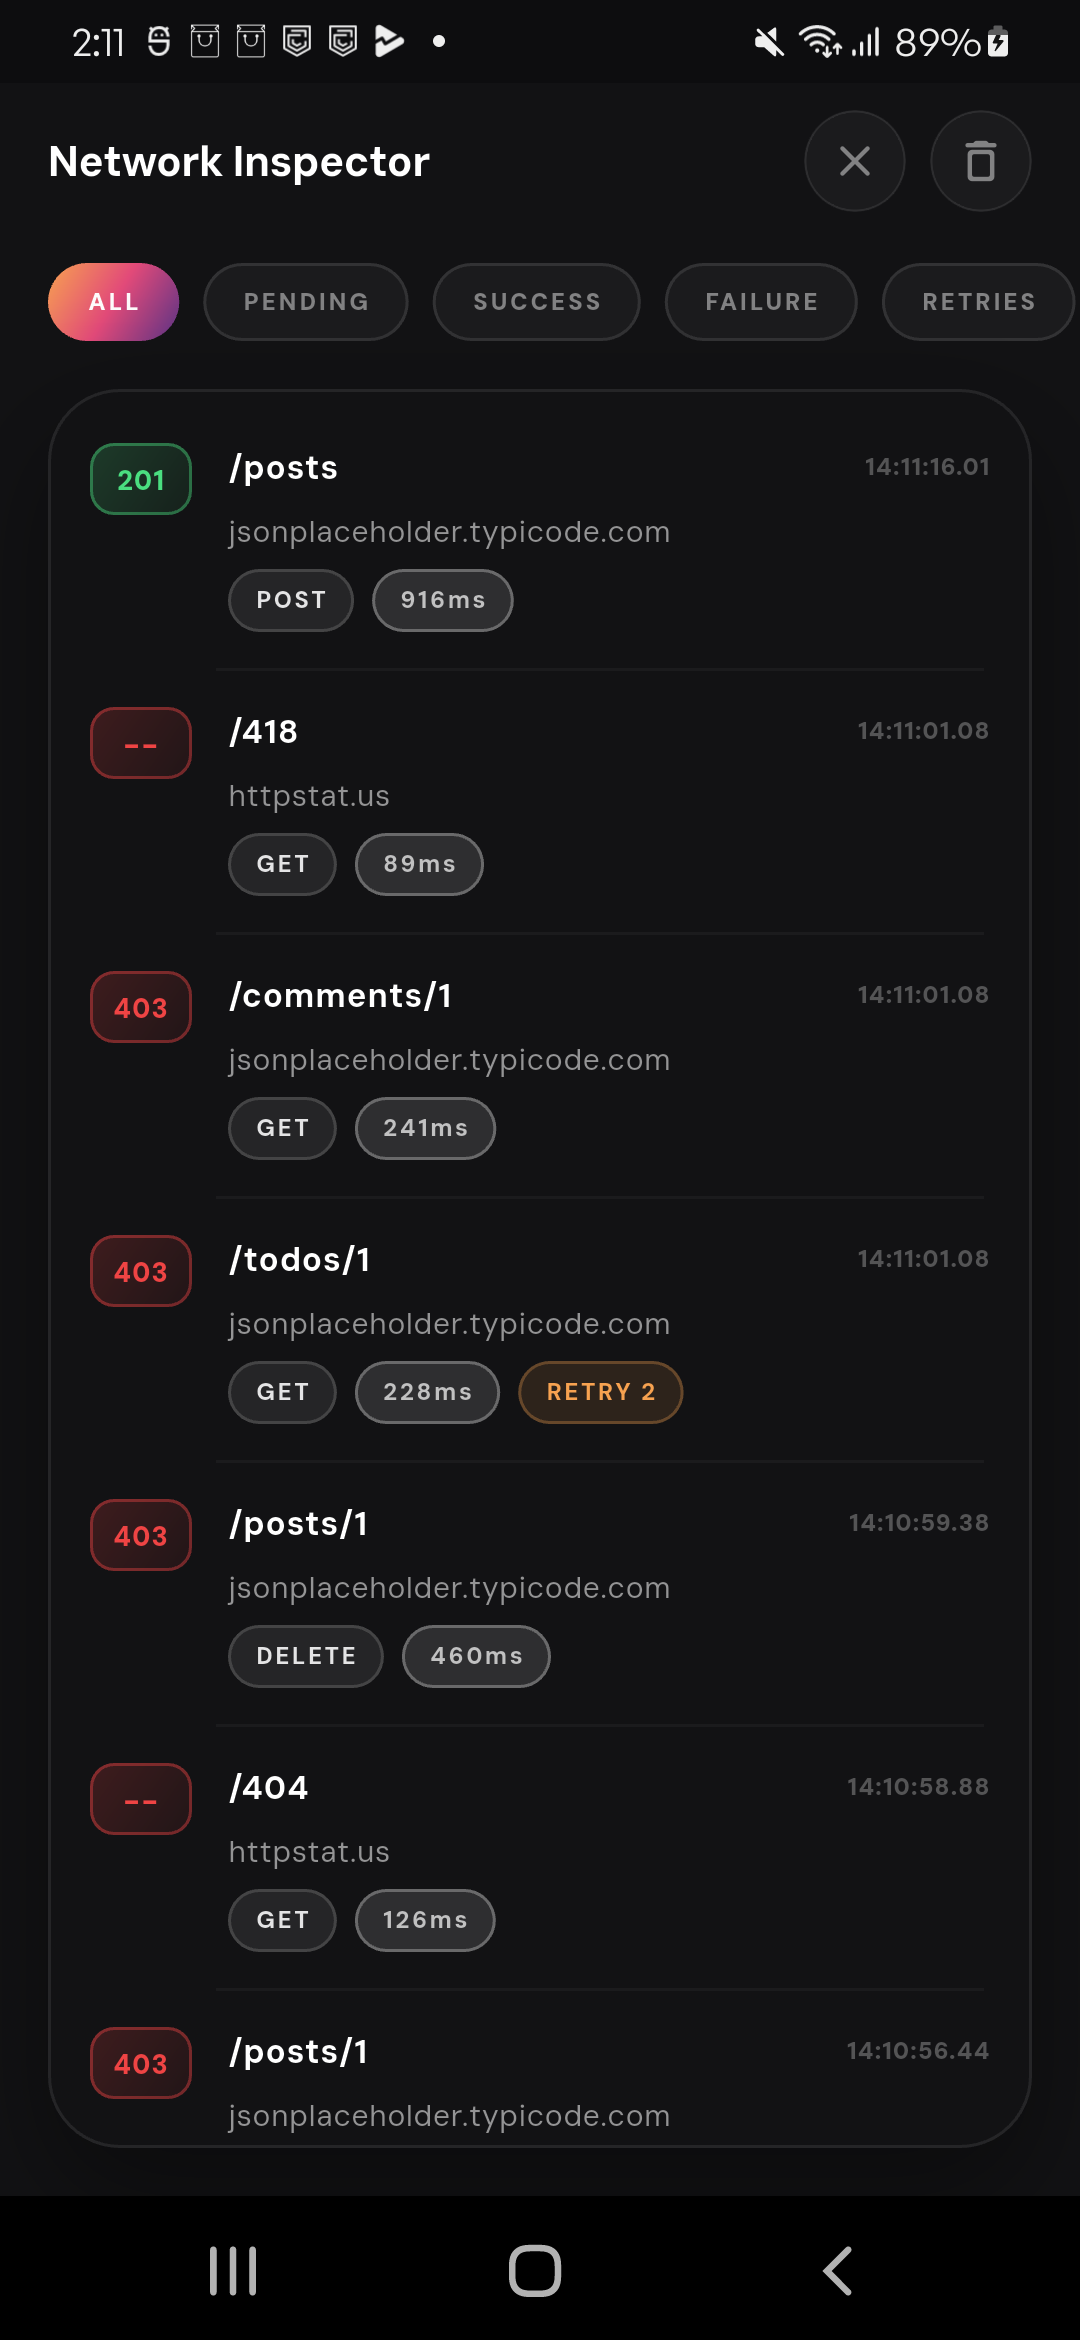 |
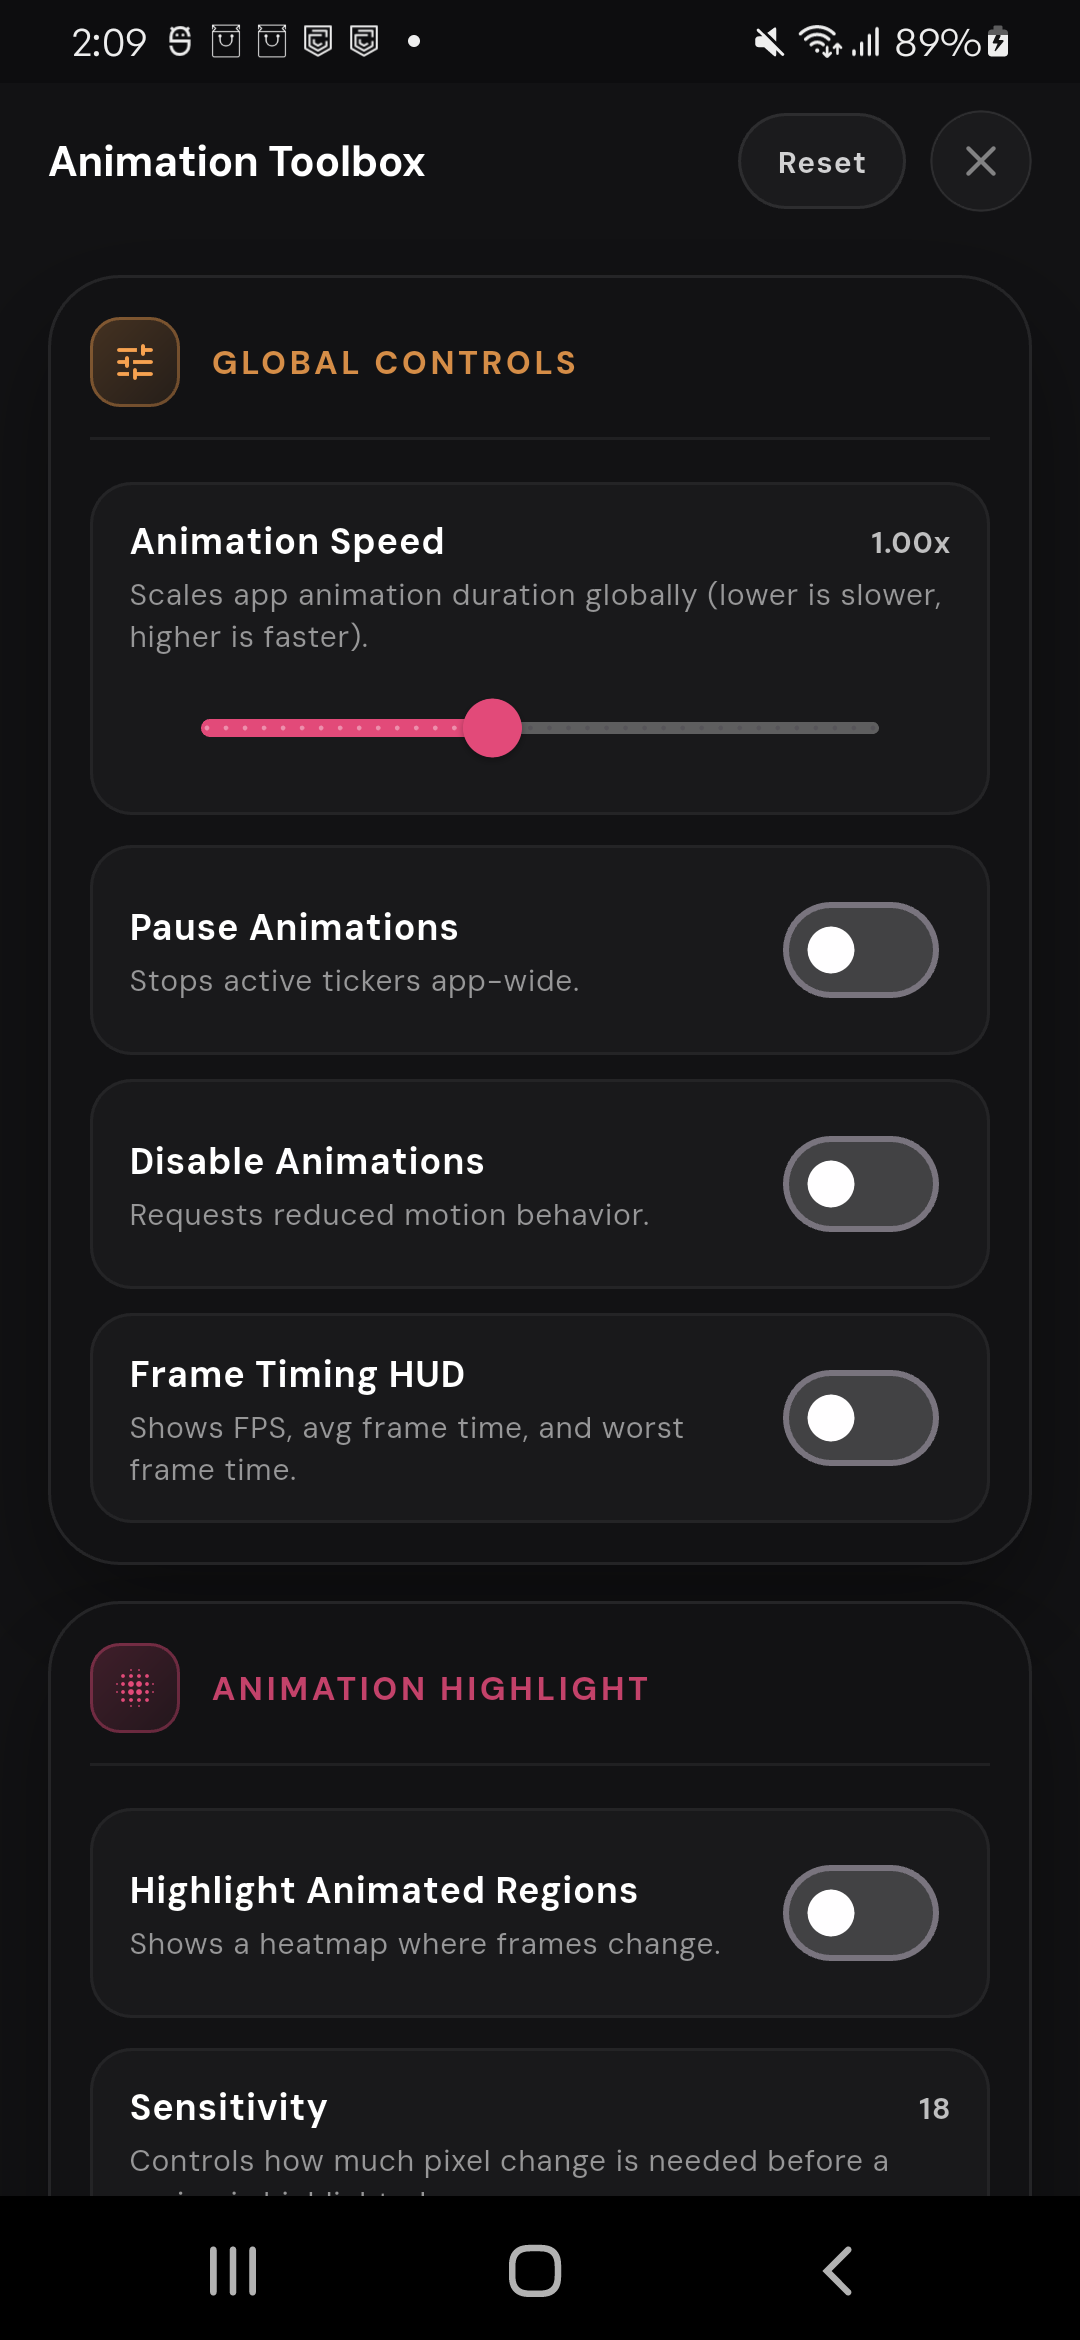
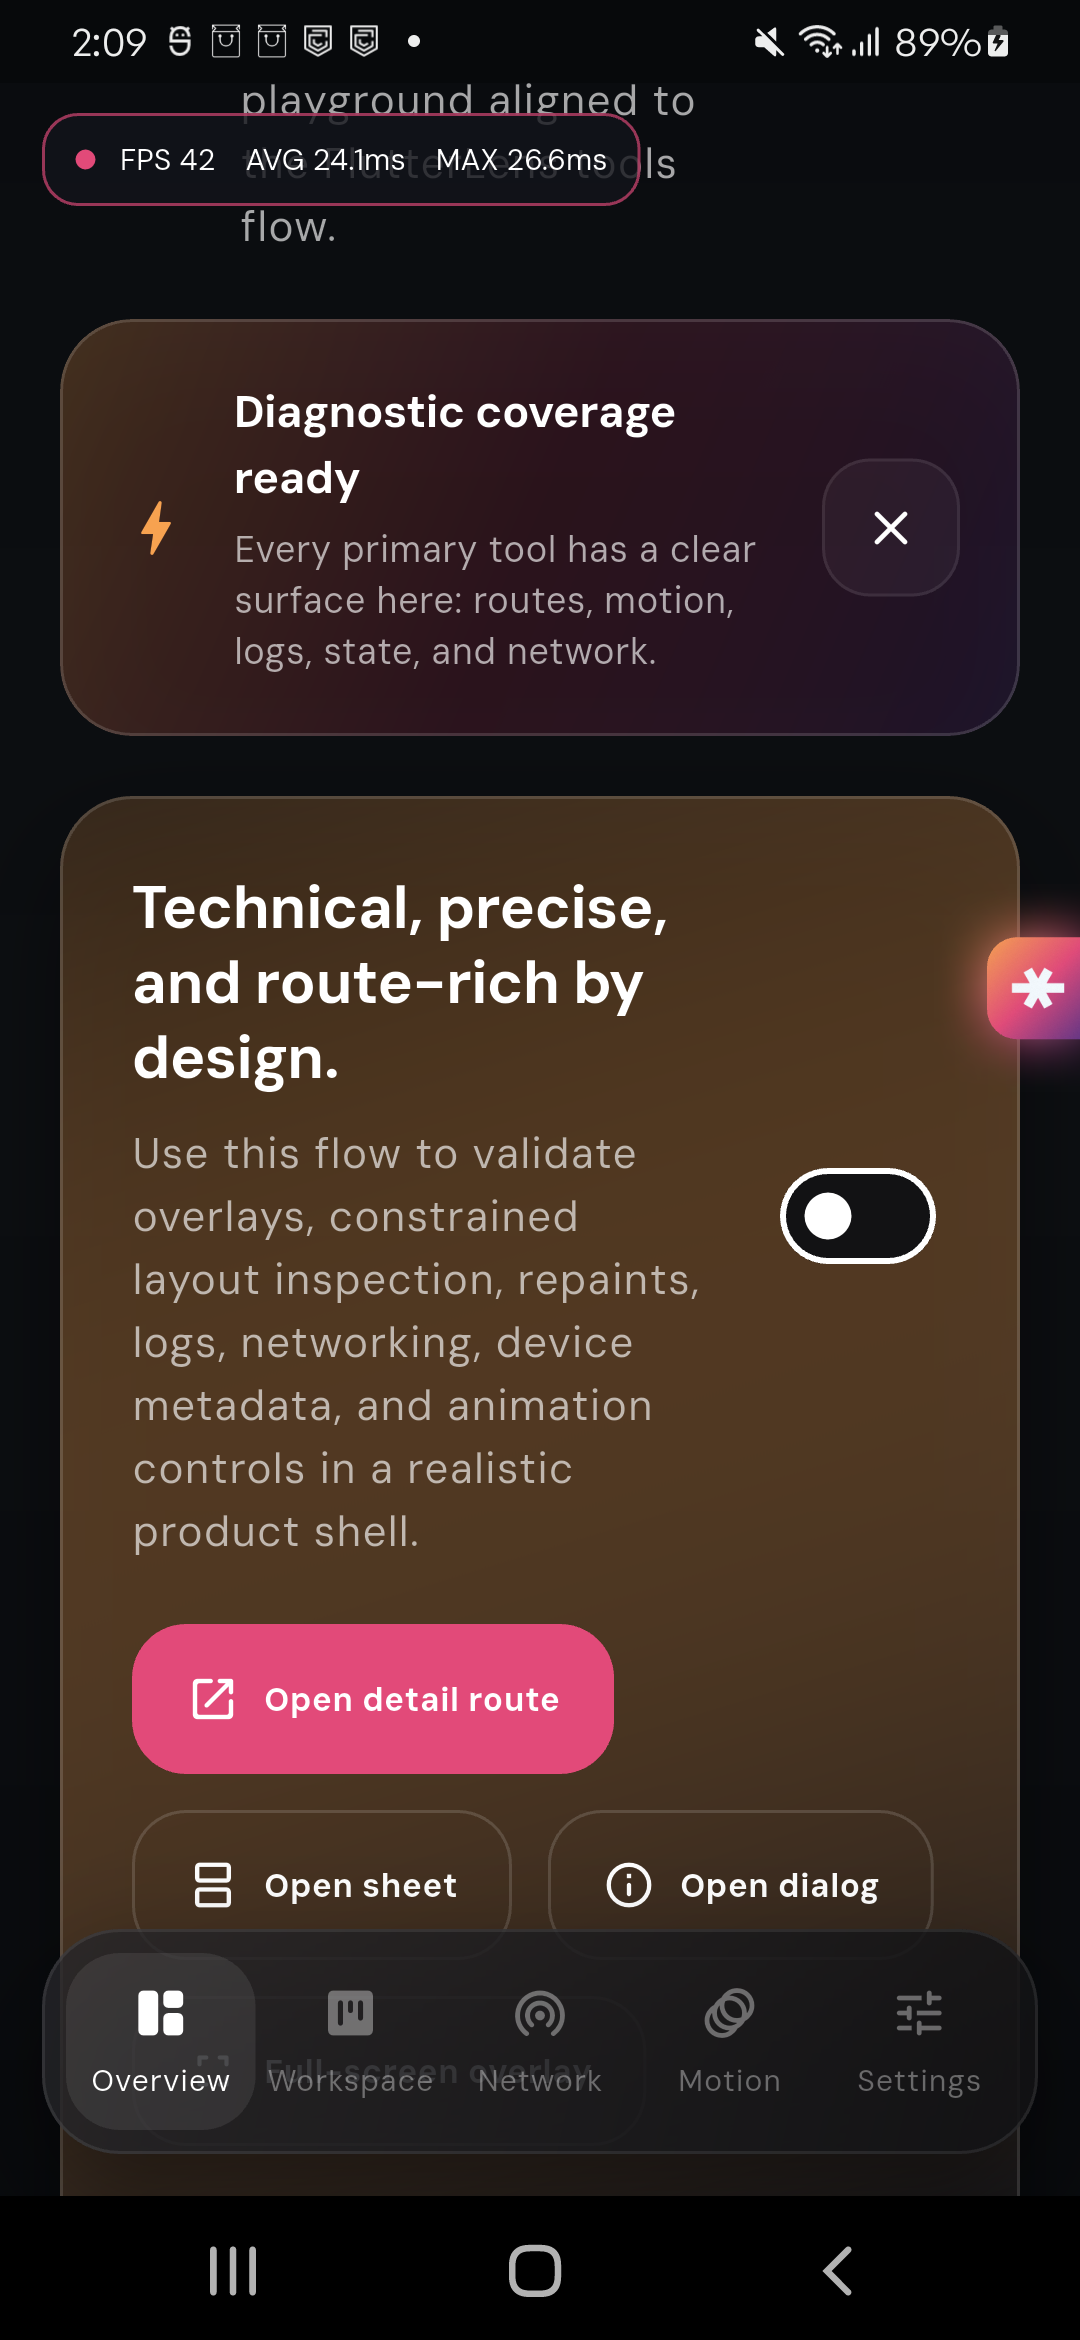
| 🎛️ Animation toolbox with global speed, pause/disable toggles, frame timing HUD, and animated-region highlighting controls. | 📈 Frame timing HUD in context showing live FPS, average frame time, and max frame time over the app surface. | 🌐 Network inspector list view with status filters, HTTP methods, durations, and retry markers for requests. |
 |
||
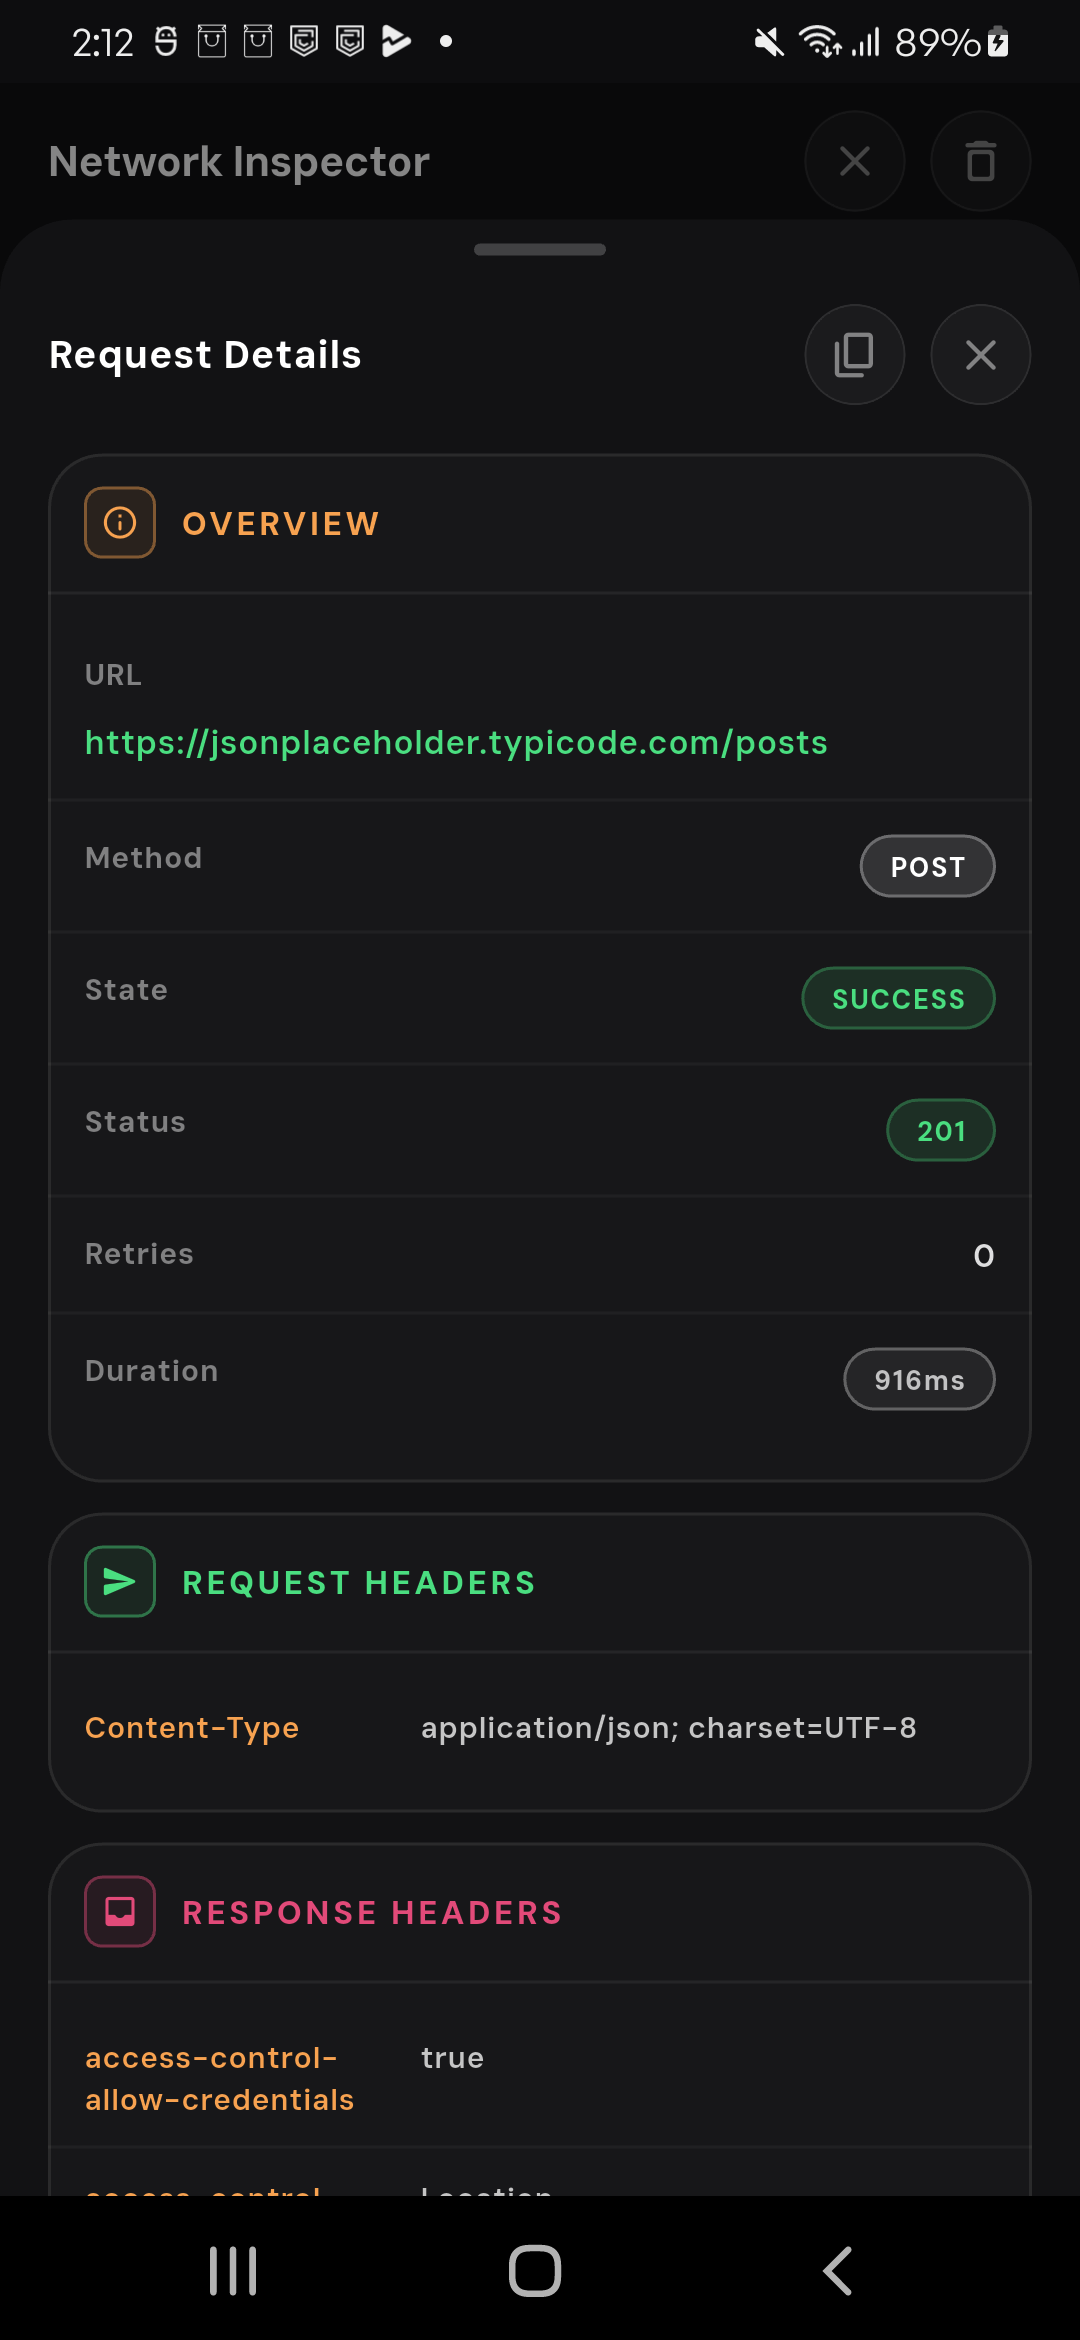
| 🔎 Network request details sheet with URL, method, status, duration, and request/response headers for deep inspection. |
- 🧭 Screen Name Overlay: See the active route/screen while navigating.
- 📋 Debug Logs Viewer: Capture and inspect console logs inside the running app.
- 🌐 Network Inspector: Capture request/response timing, headers, payloads, failures, and retry attempts.
- 📱 Device Details: Inspect model, OS, screen metrics, and hardware info in-app.
- 🎯 Color Picker: Pick any on-screen pixel color quickly.
- 🧱 Debug Paint / Layout Insights: Visualize layout boundaries and spacing behavior.
- 🌈 Repaint Rainbow: Spot frequent repaints to detect expensive widgets.
- 🎛️ Animation Toolbox: Control animation speed, pause, disable animations, frame timing HUD, and animated-region highlights.
- Includes global curve presets (for example:
System,Linear,Ease In Out,Bounce Out, and more) for animations that opt into FlutterLens curve scope.
- Includes global curve presets (for example:
- ⚡ Performance Overlay Toggle: Enable Flutter performance overlay directly from the panel.
- 🧲 Edge Tray Launcher: Open FlutterLens from a draggable edge tray.
- 🧾 Version Ticker: Live ticker for app/build/flutter/dart/FlutterLens versions.
- 🎨 Picked Color Card: View HEX/RGB/HSL + copy from the panel.
- 💾 Sticky Debug Toggles: Core flags are persisted across launches.
Debug Paint→ togglesdebugPaintSizeEnabledSize Info→ enables render box inspector overlayRepaint Rainbow→ togglesdebugRepaintTextRainbowEnabledDebug Logs→ opens in-app logs viewerNetwork Inspector→ opens in-app request/response inspectorPerf Overlay→ togglesshowPerformanceOverlayColor Picker→ pixel pick + color card/copy flowDevice Details→ opens device info sheetScreen Name→ route name overlay (withDebugNavigatorObserver)Animation Toolbox→ animation speed/pause/disable/highlight controls
Add this to your pubspec.yaml:
dependencies:
  flutter_debug_tools: ^2.0.5
Then run:
flutter pub getimport 'package:flutter/material.dart';
import 'package:flutter_debug_tools/flutter_debug_tools.dart';
Future<void> main() async {
await DebugLogCapture.runApp(() async {
runApp(const MyApp());
});
}
class MyApp extends StatelessWidget {
const MyApp({super.key});
@override
Widget build(BuildContext context) {
final navigatorObserver = DebugNavigatorObserver();
return FlutterLens(
builder: (context, showPerformanceOverlay, child) {
return MaterialApp(
title: 'FlutterLens Demo',
showPerformanceOverlay: showPerformanceOverlay,
navigatorObservers: [navigatorObserver],
home: const Placeholder(),
);
},
);
}
}import 'package:flutter/material.dart';
import 'package:flutter_debug_tools/flutter_debug_tools.dart';
void main() {
runApp(const MyApp());
}
class MyApp extends StatelessWidget {
const MyApp({super.key});
@override
Widget build(BuildContext context) {
return FlutterLens(
builder: (context, showPerformanceOverlay, child) {
return MaterialApp(
showPerformanceOverlay: showPerformanceOverlay,
home: const Placeholder(),
);
},
);
}
}Animation Toolbox curve presets apply to animations that resolve their curve from FlutterLensAnimationCurveScope:
final curve = FlutterLensAnimationCurveScope.resolve(context, Curves.easeInOutCubic);

AnimatedContainer(
  duration: const Duration(milliseconds: 500),
  curve: curve,
  child: const Placeholder(),
)FlutterLens(
isEnabled: kDebugMode,
builder: (context, showPerformanceOverlay, child) {
return MaterialApp(
showPerformanceOverlay: showPerformanceOverlay,
home: const HomeScreen(),
);
},
)- ✅ Captures Dart-side console logs (including
printoutput in the wrapped zone) - ✅ Captures framework/platform error callbacks and shows them in the logs viewer
- ✅ Lets you filter logs by level (
All,Info,Warn,Error,Debug) - ✅ Tap any log row to copy it to clipboard
If you already use another logger, you can still use it; FlutterLens will continue showing captured console/error output in the viewer.
print(...)output (insideDebugLogCapture.runAppzone)FlutterError.onErrorPlatformDispatcher.instance.onError- uncaught zoned async exceptions
DebugLogCapture.install()DebugLogCapture.runApp(() async { ... })DebugLogStore.instance.add(...)DebugLogStore.instance.clear()
To populate route names in the Screen Name overlay, attach DebugNavigatorObserver:
MaterialApp(
  navigatorObservers: [DebugNavigatorObserver()],
  home: const HomeScreen(),
)- Swipe down on the panel to dismiss.
- Tap outside the panel to dismiss.
- Drag the right-edge tray up/down to reposition.
- Tap the tray to open FlutterLens.
- Captures requests made through
dart:ioHttpClient(including typicalpackage:httpusage on Android/iOS/desktop). - Does not capture web
fetch/XHRtraffic.
- Use FlutterLens only in debug/dev environments.
- Add
DebugNavigatorObserverfor better route visibility in overlays. - Keep an eye on
Repaint Rainbow+Performance Overlaytogether for quick perf diagnosis. - Use
FlutterLensAnimationCurveScope.resolve(...)in your app animations when you want Animation Toolbox curve overrides to affect them. - Network Inspector currently targets
dart:ioHttpClienttraffic. - If Dart/Flutter versions show fallback values, pass build-time dart-defines for those keys.
Built with:
- Bug report: Open issue
- Feature request: Open request
- PRs are welcome! 🎉
MIT License